Long
BSV - The Flippening - Part 3 - Strong Buy
$BITFINEX:BSVUSD remains a Strong Buy.
Analysis Method: Fibonacci & Wave Theory
Immideiate Target: $380-$470
Near-Term (30-60 days): $1,400
Please see previous $BITFINEX:BSVUSD analyses for further information
Long story short, COINBASE:BTCUSD was compromised by two competing factions of crypto engineers.
The factions working on the protocol BITSTAMP:BTCUSD couldn't come to an agreement on how to scale COINBASE:BTCUSD .
The disagreement led to COINBASE:BTCUSD being forked resulting in COINBASE:BCHUSD .
But, the factions continued to disagree which resulted in COINBASE:BCHUSD being forked. The fork created POLONIEX:BCHABCUSDT and BITFINEX:BSVUSD .
The disagreements put the 'Nakamoto Consensus' to the ultimate test.
Nakamoto consensus is a name for Bitcoin’s decentralized, pseudonymous consensus protocol. It is considered as Bitcoin’s core innovation and its key to success. The consensus protocol doesn’t require any trusted parties or pre-assumed identities among the participants.
Consensus can be reached by selecting the “longest” chain of valid blocks. In the Bitcoin whitepaper, and some other documentation, it is indicated that the honest chain grows the longest, assuming that 51% or less of the miners are malicious. Therefore, the longest chain can be considered to be the chain with the most invested Proof-of-Work:
In short, Miners use their hash to vote on the Blockchain.
Miners supporting POLONIEX:BCHABCUSDC will move their hash to mine its Blockchain.
Miners supporting BITFINEX:BSVUSD will move their hash to mine its Blockchain.
Before the Fork, BITFINEX:BSVUSD camp had over 70% of Miners hash. (Important)
Last week, Bitcoin Cash (BCH) personalities proposed a 12.5% tax on mining rewards that would ostensibly go to funding network development.
Cointelegraph reported last week on the proposed tax published by Btc.top CEO Jiang Zhuoer. The “infrastructure funding plan” would have miners send 12.5% of mining rewards to an entity in Hong Kong. The co-signing entities repped 27% of hashrates. Most controversially, the proposal included “orphaning” non-compliant miners — the practice of removing blocks from the chain that resembles a 51 percent attack.
Critics underscored the routing of funds to a CORPORATION instead of a nonprofit and the absenting of a voting procedure, which would mean COMPANY OWNERS would control BCH development. Other complaints included CHINESE government interference and profitability since the tax would affect miner revenues.
BCHABC's fate will be determined by Miners. When BCHABC's Hash is gone...Game Over.
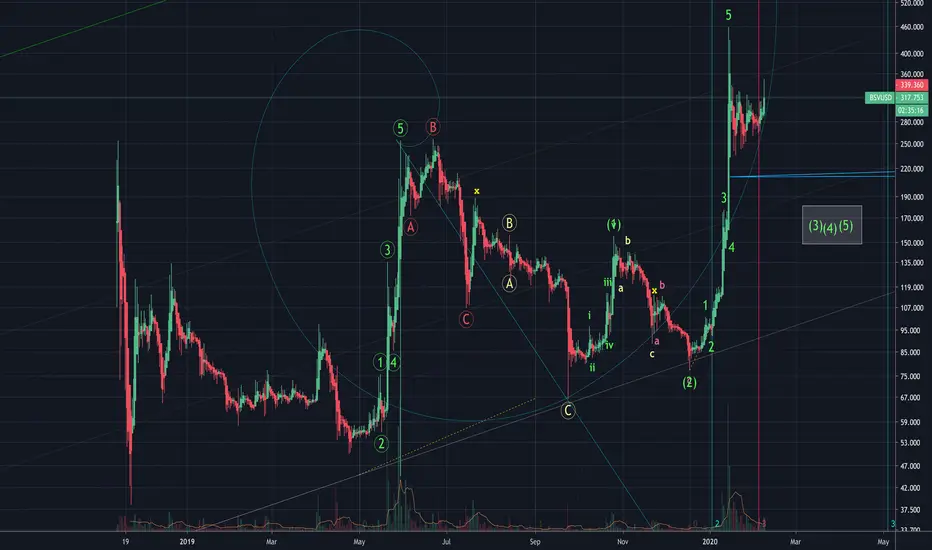
Pick-up from previous analysis:
Daily Chart: High Wave 3 underway...

Hourly Chart: Completed Micro-wave 1 & 2

Micro-Wave 3 is underway...
Key Levels: $360 & $380
Will update.
FMW
Analysis Method: Fibonacci & Wave Theory
Immideiate Target: $380-$470
Near-Term (30-60 days): $1,400
Please see previous $BITFINEX:BSVUSD analyses for further information
Long story short, COINBASE:BTCUSD was compromised by two competing factions of crypto engineers.
The factions working on the protocol BITSTAMP:BTCUSD couldn't come to an agreement on how to scale COINBASE:BTCUSD .
The disagreement led to COINBASE:BTCUSD being forked resulting in COINBASE:BCHUSD .
But, the factions continued to disagree which resulted in COINBASE:BCHUSD being forked. The fork created POLONIEX:BCHABCUSDT and BITFINEX:BSVUSD .
The disagreements put the 'Nakamoto Consensus' to the ultimate test.
Nakamoto consensus is a name for Bitcoin’s decentralized, pseudonymous consensus protocol. It is considered as Bitcoin’s core innovation and its key to success. The consensus protocol doesn’t require any trusted parties or pre-assumed identities among the participants.
Consensus can be reached by selecting the “longest” chain of valid blocks. In the Bitcoin whitepaper, and some other documentation, it is indicated that the honest chain grows the longest, assuming that 51% or less of the miners are malicious. Therefore, the longest chain can be considered to be the chain with the most invested Proof-of-Work:
In short, Miners use their hash to vote on the Blockchain.
Miners supporting POLONIEX:BCHABCUSDC will move their hash to mine its Blockchain.
Miners supporting BITFINEX:BSVUSD will move their hash to mine its Blockchain.
Before the Fork, BITFINEX:BSVUSD camp had over 70% of Miners hash. (Important)
Last week, Bitcoin Cash (BCH) personalities proposed a 12.5% tax on mining rewards that would ostensibly go to funding network development.
Cointelegraph reported last week on the proposed tax published by Btc.top CEO Jiang Zhuoer. The “infrastructure funding plan” would have miners send 12.5% of mining rewards to an entity in Hong Kong. The co-signing entities repped 27% of hashrates. Most controversially, the proposal included “orphaning” non-compliant miners — the practice of removing blocks from the chain that resembles a 51 percent attack.
Critics underscored the routing of funds to a CORPORATION instead of a nonprofit and the absenting of a voting procedure, which would mean COMPANY OWNERS would control BCH development. Other complaints included CHINESE government interference and profitability since the tax would affect miner revenues.
BCHABC's fate will be determined by Miners. When BCHABC's Hash is gone...Game Over.
Pick-up from previous analysis:
Daily Chart: High Wave 3 underway...
Hourly Chart: Completed Micro-wave 1 & 2
Micro-Wave 3 is underway...
Key Levels: $360 & $380
Will update.
FMW
Note
Micro-Wave Sequence CompleteNote
Broke $360...Note
Next is $380...Note
Hourly Chart Update:Note
After $380...Target Area - $429-$493
Note
This correction sequence should be completed quickly...Note
Note
Timeframe: <5 DaysNote
Daily Chart Update:Note
Note
15 Minute Chart (Above) 30 Minute Chart (Below)
Note
*Corrected 15 Min w/o Blue Lines Note
Looking to break $380...Note
Daily Chart Update:Note
Note
Correction is over...Should be moving towards the targets...
Note
When $380 breaks...price-action will test $360...then go higher towards $470Note
When $470 breaks look to $620Note
Target Area: $620-$858
Note
Mini Wave Sequence and CorrectionNote
Wave 1:low. If you can count a minor 1-2-3-4-5, you have probably seen the completion of a tiny wave 1 in a new cycle. So now you will get ready to buy on the dip.In my experience, wave 1 is rarely a clean formation. The markets tend to build a base after a steep increase/decline, and very often we will get repeated tests of new resistance levels.
Occasionally, the move will resemble a wedge, which is known by a special name: diagonal triangle.
Some traders will use oscillators and divergence studies to gain in confidence. What I do is keep Elliott Wave Principle/Fibonacci Analysis as your main tool, and use other TA tools to support your main view.
Note
Note
Note
We broke through Fib Channel .786 and are testing the $360 level for support.Still need to break $380...this should be imminent.
Estimated Timeframe for the 1st Target Area is 2 days 12 hours...
Note
Note
Note
Note
We have completed Sub-Micro Waves 1,2,3,4...Sub-Micro Wave 5 should begin momentarily...
Waves 1 + 3 trended near equality...
Wave Rule - 1/3 Waves will extend
Looking for Sub-Micro Wave 5 to extend and break $380!
Note
Note
Fib Channel .786 is now support. Note: Minuscule Wave 5 Extended
Note
Daily Chart Update:Note
Note
Note
Time to break $380...Note
Sub-Waves 1 & 3 trended toward equality (+6.98%)Note
S-Wave 5 should be greater than 6.98%Note
Immediate Target Hit.Note
High was $382.xx. After hitting the immediate target, the price-action broke down...
Note
Note
Above: Daily Chart Update.Note
Note
If you implemented Wave Sequence STOPs you made out quite well with this pullback.Note
Will provide further analysis shortly.Note
Note
Note
Above: 5 Min Chart - RecoveryNote
We have had a Reflex with a 5 Wave Sequence3rd Wave Extended
Note
Note
Sub-Micro Sequence Wave 1 & Wave 2 were 'normal'Note
Note
This is where the price-action broke down....Note
We broke $380 but not strong enough to keep the rally going without a correction sequence. Near-Term Target is still in place.
Note
Note
I hit a STOP at $346.00Note
Looking for a breakout in less than 5 days...Note
Sub-Wave 3 Target Area:Note
$355-$398...Looking for an extended 3rd Wave since the lower degree was extended.
Note
We should be moving towards Sub-Wave 3 Target Area very soon.Note
Looking for $398 to be taken out in this next wave...Note
Estimate for S-Wave 3 to begin moving higher: <6 hours
Target Area: $355-$398
Note
Daily Chart Update:Note
6 Hour timeframe got extended due to a complex correction...Note
Note
New Sub-Wave 3 Target Area: Note
Target Area: $346-$389Note
Note
Note
We should be getting extremely close to a new wave sequence higher!Note
Note
Corrections should be over.Note
We had another correction sequence...Note
3 Corrections...Note
Note
Breakout is imminent...Note
Almost Game Over...Things are speeding up...
Note
Interest Rates are collapsing...Note
Powerful people do not want Crypto to take off...When it does, there will be no stopping it.
Note
We did form a Mini Wave Sequence...But, it failed.
Note
My guess is a hash dump...Note
Note
Both STOPs were triggered...SOFT = 50% Position
HARD = 100% Position
Note
Note
Daily Chart Update:Near-Term Target still in Timeframe...
Note
Looking for a 'Spike'Note
Note
Anyone ask why the hype about the COVID-19?Note
Wall to Wall new coverage? Quarantine? Pandemic?Compare and contrast Influenza Vs. COVID 19...
Note
So far, the new coronavirus, dubbed COVID-19, has led to more than 75,000 illnesses and 2,000 deaths, primarily in mainland China. But that's nothing compared with the flu, also called influenza. In the U.S. alone, the flu has already caused an estimated 26 million illnesses, 250,000 hospitalizations and 14,000 deaths this season, according to the Centers for Disease Control and Prevention (CDC).Note
I think this is the REAL reason for the SP's declines...
Note
The Fed is in one hell of a situation...Note
The Dollar's Chart is extremely bearish...Note
HYG Chart is extremely bearish:Note
If anyone is falling my SP500 Analysis this chart should be very familiar...Note
Note
755 Days = 18.15%Note
Note
547 Days = 6.32% (Without REPO)Note
197 Days - Billions of Liquidity Daily = 20.07% (W/ REPO)Note
Research firm Reorg reported that 2019 was the busiest year for chapter 11 filings since it started tracking them in 2015. For chapter 11 cases filed by companies with more than $100 million in liabilities, the filing frequency increased 24% from 2018. One hundred fourteen companies with liabilities exceeding $100 million filed for chapter 11 protection in 2019, compared to 87 in 2018. The most cases were filed in the energy sector, followed by the consumer discretionary and health care sectors.Note
The report from the 36-member Organisation for Economic Co-operation and Development (OECD) highlighted that compared to previous credit cycles, today’s trove of outstanding corporate bonds is of lower overall credit quality.This may render the non-financial corporate sector and broader economy more vulnerable to the negative effects of an economic downturn.
Note
The volume of corporate debt hit an all-time high of $13.5 trillion at the end of 2019, but the overall quality of bonds fell below levels seen before the global financial crisis, according to a new OECD report.Note
Corporate Debt and Record CEO Resignations...hand in hand?Note
IPSASB consults on revenue and transfer expenses standardsThe International Public Sector Accounting Standards Board (IPSASB) is consulting on three inter-connected exposure drafts which are intended to pioneer new approaches to accounting for some of the most significant transactions of public sector entities
Defining Your Role in Implementing New Revenue Recognition
It's 2020, time for FASB’s Accounting Standards Codification 606 to kick in. Is your firm ready to handle it?
Note
In this publication, we’ve summarized the new accounting standards with mandatory[1] effective dates in the first quarter of 2020 for public entities, as well as new standards that take effect in annual 2019 financial statements for nonpublic entities. Those effective dates reflect the FASB’s recent decision to defer certain major standards. We have also included links to BDO’s guidance on each pronouncement.Note
Boeing's CEO is out. Here are the 37 most dramatic exits in a record-breaking year for CEO departures.During the first three quarters of 2019, 1,160 CEOs left their positions, according to the staffing firm Challenger, Gray, & Christmas.
This figure exceeds the number of CEOs who departed during the same nine-month span at the height of the 2008 recession (which saw 1,132 CEO departures).
The tech sector has seen the second-highest number of CEO departures, with 154 executives in that industry leaving their positions.
In the first week of December, four CEOs announced their resignations: Susan Desmond-Hellmann at the Bill & Melinda Gates Foundation, Oscar Munoz at United Airlines, Larry Page at Alphabet, and Mark Okerstrom at Expedia.
The latest departure is Boeing CEO Dennis Muilenburg, who resigns amid fallout from two plane crashes that occurred under his tenure.
Salesforce co-CEO Keith Block steps down
Disney's Bob Iger Is Out In Big CEO Shakeup
Note
businessinsider.com/biggest-ceo-departures-wework-juul-ebay-warner-bros-metlife-2019-10Over 1,160 CEOs out...WHY?
Note
Think GE...Notorious for nailing Earnings exactly for years, now to find out it is struggling to survive...
Note
We have bottomed here.Note
Note
No real resistance till $380.Note
Note
Above 5 Second Wave CountNote
Note
5 Second Wave Count & Corrections...New Wave should begin now...
Note
Want to see Crypto start to rally...Note
Note
If you want you could put a stop under $204...Note
Note
I still believe we have bottomed here...Correction was weak...
Note
NEWS TODAY: FED MUST CUT TO STOP PANDEMIC?!INSANITY
Note
Worst Drop in HISTORY because a Flu like virus has infected .0001% of the population.Note
Ebola? Market Drop?SARS? Market Drop?
Note
The Central Banks...OUT OF AMMO.
In my opinion...
Note
Interest Rate Check:snipboard.io/o3Bra0.jpgNote
Note
Above: Daily Chart UpdateNote
This is a crossroad in history...Note
Centralized Authority that controls Monetary Policy is on its last breath...Note
We are witnessing the collapse of the Federal Reserve.The 'Business News' is almost laughable...
If anyone can tell me how a rate cut can stop a 'Pandemic' I would love to hear it...
Note
Reminder: No significant resistance until $380...Note
Daily Chart Update:Note
Note
BSV is breaking out...Micro-Wave Leading Diagonal formed...
Still anticipating a 'spike'...
Note
Daily Chart update:Note
If Cryptocurrency breaks out it kills the 'virus' story...Note
Note
Correction sequence almost complete...Note
I don't like this price-action...Seems like it is being forced down...
Note
We have very strong support here...Note
Note
Added Fib Time...Note
Immediate Target: $272-$304Timeframe: <5 Days
Note
Daily Chart Update:Note
Hourly Chart Update:Note
Extending Sub-Wave 1:Note
Note
Note
BSV The Flippening Part 4 - Coming SoonNote
Federal Reserve Note - On life support...About to have a cardiac arrest...
Note
The Cryptocurrency Protocol that scales with low transaction fees will dominate the New Monetary Order...The world will be multi-protocol...
Note
Sub-Wave Count:Note
Hourly Chart Update:Note
30 Minute Chart:Note
X = Complex SequenceWe had another ABC Correction (ZigZag)
The Correction looks to be over.
Note
5 Min Chart (Micro/Sub Wave Sequence)Note
Note
Added Fib Time to Micro-Wave Sequence...Note
Note
In approximately 1 Day and 21 Hours we should hit the immediate target price area which is between $270-$300...Note
Daily Chart Update:Note
Anticipating a major breakout in less than 5 days...Note
1 Minute Count:Note
Global Markets are entering unprecedented territory...Note
Note
Price is being squeezed...Note
Note
Above: 5 Second Wave CountNote
Minuscule correction is ending...Note
Note
Just wait till Central Banks start buying...They will be forced too...
Note
Note
Note
About $11 trillion of corporate, sovereign, and securitized bonds in 24 currency markets trades at negative yields, comprising about 20 percent of the value in these markets.Note
Global Deposit Rates:snipboard.io/WBp6lj.jpg
Note
Fib Time Marker: 8 MAR 20 15:47 hit...Note
Note
Update:Note
Micro-Wave Failed...Sold off in 3 Waves (Weak)
Price is being squeezed...
Optics of Market Crash and Crypto Market Boom (Not Ideal)
Sellers will have to cover very soon...
Note
Immediate Target of $270-$300 remains...Timeframe remains...
Note
Chart Update:Note
Note
SP500 V. TOTAL (Crypto Market) V. BSVNote
Note
We are watching the Old (rigged) Monetary System fail.Note
Note
Wait for it...Note
30 Second Count:Note
Note
1 Minute Count:Note
Watch the Narrative shift when the Crypto Markets move higher and the Stock Market moves lower...Very few people understand what is occurring...
Note
Update:Note
Squeeze should be coming off...Note
Note
Almost 26 days of being squeezed lower...Note
It will be like a rubber band when it comes off...Note
Just as one could get a complex correction in the form of a double zigzag, one could also get a complex combination of two flats! Not surprisingly Elliott called it a double flat! (If you get a combination of three flats, it will be called a triple flat) Just like a normal flat will have as its internal waves a 3-3-5 pattern, so also each of the two flats that combine using an X wave in between will also have a 3-3-5 pattern.Note
There are four main categories of corrective waves: Zigzags, Flats, Triangles and Combinations.Note
An important clue is when an complex correction appears either after wave 1 or wave 3, (i.e. if either wave 2 or wave 4 is an irregular correction) then the next impulse wave will be very strong. For example, if wave 1 and 3 were normal waves, and wave 4 was an irregular correction, you can almost be certain that wave 5 will be an extended.Note
Minuscule Wave Sequence is holding...
Positive sign...
Note
Note
Note
Note Extended S-Wave 3...Note
1 Second Wave Count:Note
Note
Note
Be careful here...Note
Price-Action Broke...Selling into support...
Note
ZigZag Correction...5-3-5
Note
Note
Note
Note
March 7 - I said I expect a Strong Breakout in Less than 5 days...March 12th is the 5 day mark...
Note
BSV vs. SP500 since Dec. 31st 2019Note
Smart Money IndexSmart money index (SMI) or smart money flow index is a technical analysis indicator demonstrating investors' sentiment. The index was invented and popularized by money manager Don Hays.[1] The indicator is based on intra-day price patterns.[2]
The main idea is that the majority of traders (emotional, news-driven) overreact at the beginning of the trading day because of the overnight news and economic data. There is also a lot of buying on market orders and short covering at the opening. Smart, experienced investors start trading closer to the end of the day having the opportunity to evaluate market performance.[citation needed] Therefore, the basic strategy is to bet against the morning price trend and bet with the evening price trend. The SMI may be calculated for many markets and market indices (S&P 500, Dow Jones, etc.)
Interpretation:
The SMI sends no clear signal whether the market is bullish or bearish. There are also no fixed absolute or relative readings signaling about the trend. Traders need to look at the SMI dynamics relative to that of the market. If, for example, SMI rises sharply when the market falls, this fact would mean that smart money is buying, and the market is to revert to an uptrend soon. The opposite situation is also true. A rapidly falling SMI during a bullish market means that smart money is selling and that market is to revert to a downtrend soon. The SMI is, therefore, a trend-based indicator.
Note
Note
HODL...Great buying opportunity...
The Thesis: Monetary System (Credit System) will fail and Crypto will become the new credit system...
Reminder: Crypto has a set supply...
Note
Note
This is pure panic, irrational selling...Crypto is a Complete 180 degrees from the current credit system...
Crypto will not fail...
Note
Note
I mine BSV...My earnings tripled during this downturn which leads me to believe someone, most likely China dumped a large amount of hash. It seems like there is an all out effort to suppress the crypto market.
coin.dance/blocks/hashrate
Economics should kick-in which would lead to a very sharp recovery...
coin.dance/
Note
BTC hash rate went from 158,000 PH to 95,000 PH...Note
That is a hell of a lot of hash...Note
Above: ProfitabilityNote
Block Size: snipboard.io/g9rDLK.jpgNote
Please follow here: 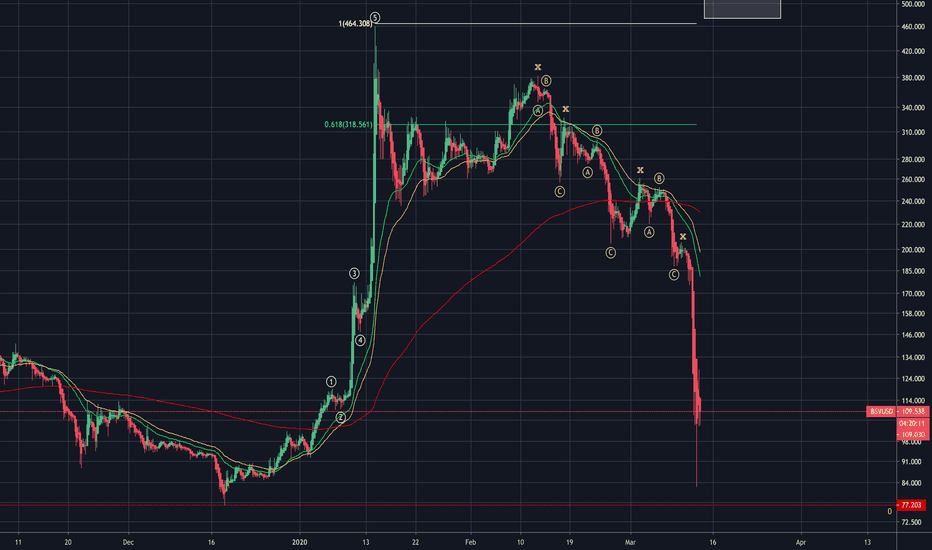
Note
Link: BSV - The Flippening - Part 4 - Strong BuyRelated publications
Disclaimer
The information and publications are not meant to be, and do not constitute, financial, investment, trading, or other types of advice or recommendations supplied or endorsed by TradingView. Read more in the Terms of Use.
Related publications
Disclaimer
The information and publications are not meant to be, and do not constitute, financial, investment, trading, or other types of advice or recommendations supplied or endorsed by TradingView. Read more in the Terms of Use.