BSX has produced decent, not great, results for me over the years. Over 1000 trade signals in its history, and it has yet to produce a loser. However, it has a tendency to get mired in some pretty long trades, so I'm going to get out of this one on the first profitable close.
Over those 1000 real and backtested trades, which to be fair, encompass some very rough times for the market, the results have barely beaten the average daily return of the market. However, the average is ruined by some anomalously long trades. Over the past 12 months, during a period that was the weakest for the stock since 2021-22, it actually performed quite well.
24 signals in the last 12 months produced 24 wins with an average daily return of .16% or about 4x the long term average daily return of the market, and double the return of SPY over the same 12 very strong months for the market. The average was skewed lower by a couple of long trades, though. Of the 24 trades, half produced gains of greater than .37%/day or 9x the long term market average. So a 50% chance of what amounts to a 93% or better annualized rate of return? Sign me up.
Other pros to this trade:
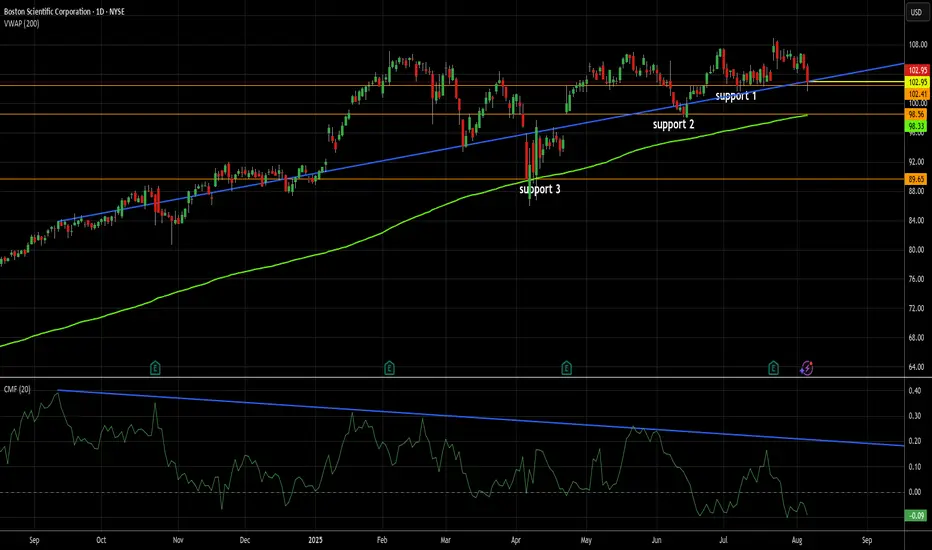
a) still above the 200d VWAP
b) earnings and revenues are up 50% and 43%, respectively, over the last 7 quarters
c) decent near term support
Concerns:
one big one - the divergence between money flow (falling) and price (rising) over the last year. Long term, that is a sign of underlying demand weakness and a potential major correction waiting to happen here unless money flow breaks above that resistance line, in which case things flip and that breakout becomes a bullish signal. We are a long way from that, however, so I still look at this as a solidly bearish signal for now.
That's why I will pull the profit trigger quickly here and why I would not necessarily advise following me on this one. One of the reasons I chose this one to post today is to use that divergence as an example to illustrate it for those new to charting.
So, I'm long at today's closing price of 102.95 and will exit at the first profitable daily close. Hopefully, this trade will be done tomorrow and I will be sitting on a per day gain of 20 or 30x the average daily market return. That's the plan, anyway. It doesn't often go that way with BSX, though. In the last year, only 4 trades closed in one day. However, 18 of the 24 (75%) closed profitably in less than a week. Given where it's at in relation to its closest support, if it isn't a one and done trade, it could become one of the 25% that last longer than a week pretty easily, I think.
As always - this is intended as "edutainment" and my perspective on what I am or would be doing, not a recommendation for you to buy or sell. Act accordingly and invest at your own risk. DYOR and only make investments that make good financial sense for you in your current situation.
Over those 1000 real and backtested trades, which to be fair, encompass some very rough times for the market, the results have barely beaten the average daily return of the market. However, the average is ruined by some anomalously long trades. Over the past 12 months, during a period that was the weakest for the stock since 2021-22, it actually performed quite well.
24 signals in the last 12 months produced 24 wins with an average daily return of .16% or about 4x the long term average daily return of the market, and double the return of SPY over the same 12 very strong months for the market. The average was skewed lower by a couple of long trades, though. Of the 24 trades, half produced gains of greater than .37%/day or 9x the long term market average. So a 50% chance of what amounts to a 93% or better annualized rate of return? Sign me up.
Other pros to this trade:
a) still above the 200d VWAP
b) earnings and revenues are up 50% and 43%, respectively, over the last 7 quarters
c) decent near term support
Concerns:
one big one - the divergence between money flow (falling) and price (rising) over the last year. Long term, that is a sign of underlying demand weakness and a potential major correction waiting to happen here unless money flow breaks above that resistance line, in which case things flip and that breakout becomes a bullish signal. We are a long way from that, however, so I still look at this as a solidly bearish signal for now.
That's why I will pull the profit trigger quickly here and why I would not necessarily advise following me on this one. One of the reasons I chose this one to post today is to use that divergence as an example to illustrate it for those new to charting.
So, I'm long at today's closing price of 102.95 and will exit at the first profitable daily close. Hopefully, this trade will be done tomorrow and I will be sitting on a per day gain of 20 or 30x the average daily market return. That's the plan, anyway. It doesn't often go that way with BSX, though. In the last year, only 4 trades closed in one day. However, 18 of the 24 (75%) closed profitably in less than a week. Given where it's at in relation to its closest support, if it isn't a one and done trade, it could become one of the 25% that last longer than a week pretty easily, I think.
As always - this is intended as "edutainment" and my perspective on what I am or would be doing, not a recommendation for you to buy or sell. Act accordingly and invest at your own risk. DYOR and only make investments that make good financial sense for you in your current situation.
Note
I screwed up and forgot to close this one on Friday. If it opens up on Monday, I'll be closing it then. Oops. Trade closed: target reached
Closed this one out right after the open today for 103.45. Glad I did, too. I wasn't expecting ALL that much from this one and it delivered about as expected. +0.49% in 2 trading days. A mediocre daily return for me, but still far better than the -0.025% return for SPY over the same 2 days, and better than the long term average for SPY as well. I'll take it. Note
Trade results for my recordsWins 1 Losses 0
Avg gain per lot = +0.49%
Avg holding period per lot = 2 trading days
Avg gain per lot per day held = +0.25%
Annualized RoR = 0.25% x 252 = +63%
Disclaimer
The information and publications are not meant to be, and do not constitute, financial, investment, trading, or other types of advice or recommendations supplied or endorsed by TradingView. Read more in the Terms of Use.
Disclaimer
The information and publications are not meant to be, and do not constitute, financial, investment, trading, or other types of advice or recommendations supplied or endorsed by TradingView. Read more in the Terms of Use.