*safe investment opportunity - low risk*
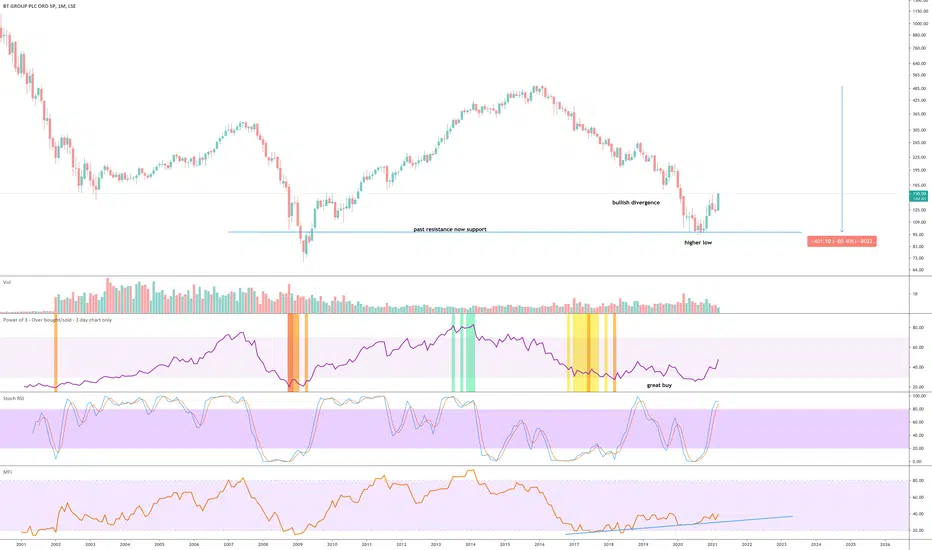
On the above monthly chart price action prints a higher low following a 80% correction since early 2016. Shortly after a 2:1 stock split. A ‘great buy’ opportunity now exists.
Why Bullish?
1) Regular bullish divergence between price action and the money flow index (MFI) - oscillator on bottom of chart.
2) Trend reversal. A higher low was printed from the crash in price action back in 2009.
3) The 3-month chart below provides a clearer picture of the overall trend between price action support and resistance. Clearly an amazing opportunity.
A buy from 130p is amazing if you can get it. Expecting price action resistance between 160-180.
Target? Around 800. This will take time 5 - 6 years but it beats cash resting in the bank account with no interest like the past 10 years!
3-month chart:
Note
Up a massive 30% already in only 3-months. Expecting some resistance between 200 - 240.Another buying opportunity might occur around 160 but that will be the last chance before higher highs are made.
Note
Perfect - playing out as indicated above / below. A buy from current levels is good. 140 excellent.Trade active
Stochastic RSI crossing up 40, safe long entry at this time.Trade active
Time to go long.. Trade active
Above higher low confirmed.BTC
bc1q2eckdzh0q8vsd7swcc8et6ze7s99khhxyl7zwy
Weblink: patreon.com/withoutworries
Allow 3-6 months on ideas. Not investment advice. DYOR
bc1q2eckdzh0q8vsd7swcc8et6ze7s99khhxyl7zwy
Weblink: patreon.com/withoutworries
Allow 3-6 months on ideas. Not investment advice. DYOR
Disclaimer
The information and publications are not meant to be, and do not constitute, financial, investment, trading, or other types of advice or recommendations supplied or endorsed by TradingView. Read more in the Terms of Use.
BTC
bc1q2eckdzh0q8vsd7swcc8et6ze7s99khhxyl7zwy
Weblink: patreon.com/withoutworries
Allow 3-6 months on ideas. Not investment advice. DYOR
bc1q2eckdzh0q8vsd7swcc8et6ze7s99khhxyl7zwy
Weblink: patreon.com/withoutworries
Allow 3-6 months on ideas. Not investment advice. DYOR
Disclaimer
The information and publications are not meant to be, and do not constitute, financial, investment, trading, or other types of advice or recommendations supplied or endorsed by TradingView. Read more in the Terms of Use.