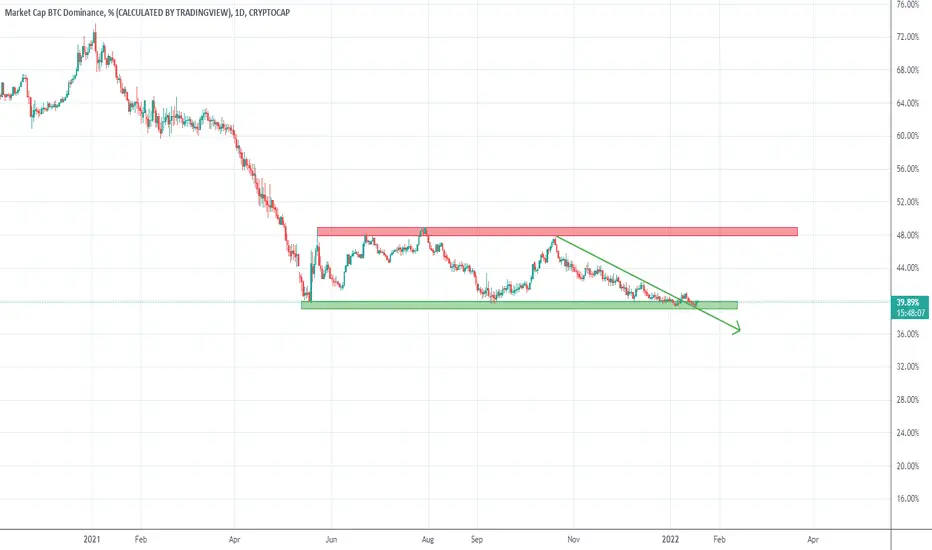
There is exactly a year now since Btc.D is trading in a downtrend. However, after reaching 40% back in May we have in fact a clear range between 40% and 50%. In mid-September, again, we touch 40% and we got back to 50% pretty quickly. The last drop takes a lot of time and is printing a falling wedge on our chart.
At this moment we are hovering around 40% for almost 2 months and Btc.D looks ready to turn.
Getting back above 40 and 41 furthermore would confirm strong support and also a double bottom (more clear on smaller TFs). If this is the case, ALTs can fall hard
At this moment we are hovering around 40% for almost 2 months and Btc.D looks ready to turn.
Getting back above 40 and 41 furthermore would confirm strong support and also a double bottom (more clear on smaller TFs). If this is the case, ALTs can fall hard
📈 Forex & XAU/USD Channel:
t.me/intradaytradingsignals
💎 Crypto Channel:
t.me/FanCryptocurrency
Related publications
Disclaimer
The information and publications are not meant to be, and do not constitute, financial, investment, trading, or other types of advice or recommendations supplied or endorsed by TradingView. Read more in the Terms of Use.