I think it is important to show this chart.
A LOT of people keep pointing towards the BTC Dominance chart as a signal for the Next ALT season.
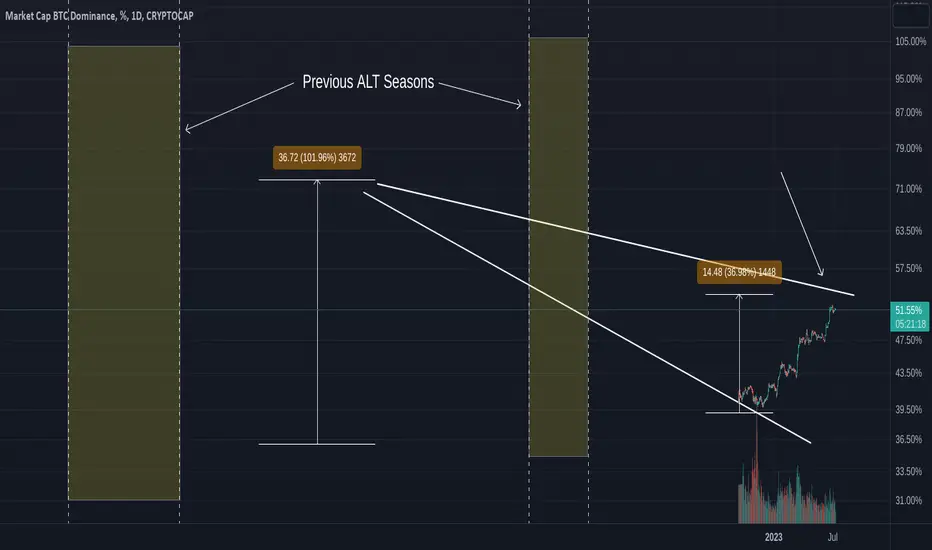
The Green Boxes show us where the 2 Major seasons occurred ( Green Boxes ) and how BTC.D rose and then has entered into a Descending channel , Fell below lower trendline and has since re-entered it and, since Dec 2022, been rising again.
Note how the PA has followed the VPVR on the right of the chart almost Exactly and has now, come to a "Blip" of resistance. Could also be seen as a window of opportunity for BTC.D right now
What is More important to take note of , is that line of resistance PA is just below because it rejected PA from Aug '19 to Nov '20 and again in Feb - March '21
It is also worth noting, na dmaking aloowences for, the Dominance of #bitcoin in the Market, or its % of Market chare, Gets reduced slightly everytime a New Coin enters the space, hence the over all Drop as seen in the chart and the smaller % Rise in ALT seasons.
If #BTC PA continues along its current Path, It will bump into that trendline around OCT this year and it is impossible to say how it will react
Just so you know
A LOT of people keep pointing towards the BTC Dominance chart as a signal for the Next ALT season.
The Green Boxes show us where the 2 Major seasons occurred ( Green Boxes ) and how BTC.D rose and then has entered into a Descending channel , Fell below lower trendline and has since re-entered it and, since Dec 2022, been rising again.
Note how the PA has followed the VPVR on the right of the chart almost Exactly and has now, come to a "Blip" of resistance. Could also be seen as a window of opportunity for BTC.D right now
What is More important to take note of , is that line of resistance PA is just below because it rejected PA from Aug '19 to Nov '20 and again in Feb - March '21
It is also worth noting, na dmaking aloowences for, the Dominance of #bitcoin in the Market, or its % of Market chare, Gets reduced slightly everytime a New Coin enters the space, hence the over all Drop as seen in the chart and the smaller % Rise in ALT seasons.
If #BTC PA continues along its current Path, It will bump into that trendline around OCT this year and it is impossible to say how it will react
Just so you know
Disclaimer
The information and publications are not meant to be, and do not constitute, financial, investment, trading, or other types of advice or recommendations supplied or endorsed by TradingView. Read more in the Terms of Use.
Disclaimer
The information and publications are not meant to be, and do not constitute, financial, investment, trading, or other types of advice or recommendations supplied or endorsed by TradingView. Read more in the Terms of Use.