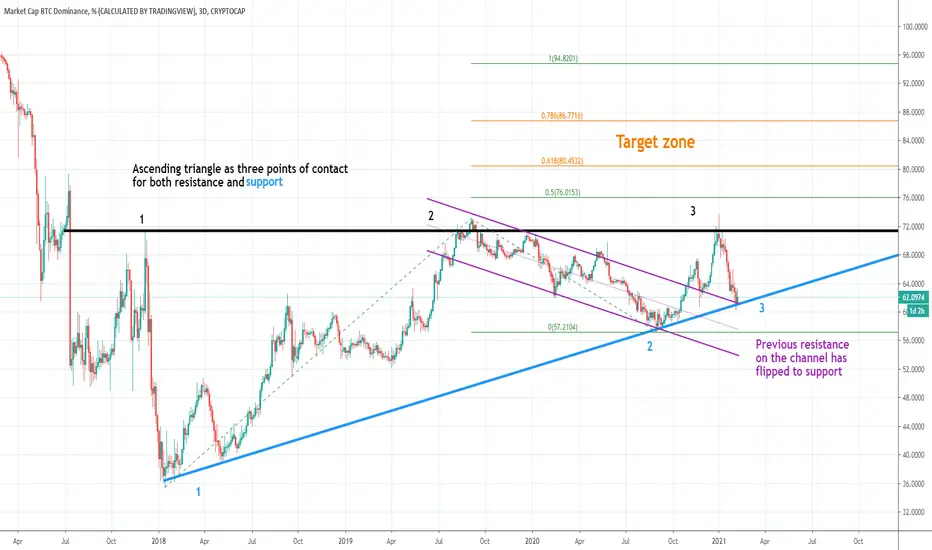
The chart is pretty simple and most the details are already on the main chart. Triangles are some of the easiest patterns to recognize and some of the worst at meeting full performance and are the most likely to bust if they are not nested in a larger macro structure. The pattern recognition is easy, we have three alternating points of support and resistance. Due to the size of this ascending triangle there is no larger structure.
At the blue 3 we see that BTC.D is at double support, both the top of the channel and the rising support of the triangle. Triangles are the most likely to bust but since we are at double support I feel we have a good chance of increasing our odds to the upside. Target area is of between the 0.618 and 0.786 fib extension levels but there may be the basic price action behaviors, such as going to a fib extension and pulling back to retest the neckline as support.
A zoom in of the channel with the nine season's rainbow shows we are getting some basing behavior as determined by the indicator showing blue. The light red indicates selling is relatively weak. Read up on the indicator here: tradingview.com/script/b8Ww0uqV-9-Seasons-Rainbow-Multiple-Time-Frames-Pattern-Standard-9SRSEN/.

The standard indicators are showing a massive amount of hidden bullish divergence on the daily. which is a great place to be if we are forecasting BTC.D will go up. MACD very likely to have a bullish cross and the histogram is divergent to price. Generally speaking, if RSI hits over-sold on the daily with hidden bullish divergence there is a strong chance that there will be a move to the upside.

Below are the times that btc.d went up while the price of bitcoin actually traded down. Which means that quite simply the alts sold of at a higher rate than bitcoin. It does not necessarily suggest that BTC was used as a store of value because they could have been tethering up or going into fiat. This chart is therefore tagged long only for BTC.D and cannot be used to suggest BTC will go up or down at this time.

In conclusion:
The chart is suggesting we should stay away from trading alts long in the short term. We might even need to stay away from trading BTC long depending on if BTC.D and BTCUSD diverge from one another again. This is a chart to keep an eye on.
At the blue 3 we see that BTC.D is at double support, both the top of the channel and the rising support of the triangle. Triangles are the most likely to bust but since we are at double support I feel we have a good chance of increasing our odds to the upside. Target area is of between the 0.618 and 0.786 fib extension levels but there may be the basic price action behaviors, such as going to a fib extension and pulling back to retest the neckline as support.
A zoom in of the channel with the nine season's rainbow shows we are getting some basing behavior as determined by the indicator showing blue. The light red indicates selling is relatively weak. Read up on the indicator here: tradingview.com/script/b8Ww0uqV-9-Seasons-Rainbow-Multiple-Time-Frames-Pattern-Standard-9SRSEN/.
The standard indicators are showing a massive amount of hidden bullish divergence on the daily. which is a great place to be if we are forecasting BTC.D will go up. MACD very likely to have a bullish cross and the histogram is divergent to price. Generally speaking, if RSI hits over-sold on the daily with hidden bullish divergence there is a strong chance that there will be a move to the upside.
Below are the times that btc.d went up while the price of bitcoin actually traded down. Which means that quite simply the alts sold of at a higher rate than bitcoin. It does not necessarily suggest that BTC was used as a store of value because they could have been tethering up or going into fiat. This chart is therefore tagged long only for BTC.D and cannot be used to suggest BTC will go up or down at this time.
In conclusion:
The chart is suggesting we should stay away from trading alts long in the short term. We might even need to stay away from trading BTC long depending on if BTC.D and BTCUSD diverge from one another again. This is a chart to keep an eye on.
And I promise every Floridian that you will all be rich... because we're gonna print some more money! Why didn't anybody ever think of this before?
~Nathan Explosion
~Nathan Explosion
Disclaimer
The information and publications are not meant to be, and do not constitute, financial, investment, trading, or other types of advice or recommendations supplied or endorsed by TradingView. Read more in the Terms of Use.
Disclaimer
The information and publications are not meant to be, and do not constitute, financial, investment, trading, or other types of advice or recommendations supplied or endorsed by TradingView. Read more in the Terms of Use.