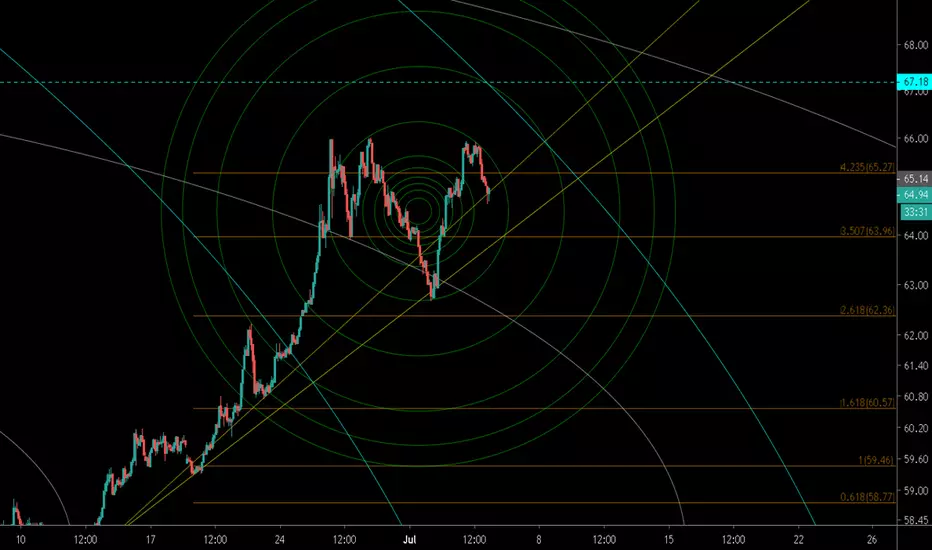
- Using Fibonacci circle to see a upcoming pivot point on short term future (Experimental).
- Still on bullish movement as it's made a same high as previous peak but it's start to show it's weakness after it's broke the previous uptrend line. if it's somehow could regain above the trend line again and maintain above the trend line is more likely the trend would continue and vice versa if the opposite do happen.
- Blue line is a previous higher high during december 2017 level.
- Orange line is golden fib ratio (fib sequence x 1.618) which act as an important consolidation area.
this is a 2 hour chart somehow cannot display the chart very well so this is for the wholesome chart looks like.

peace...
- Still on bullish movement as it's made a same high as previous peak but it's start to show it's weakness after it's broke the previous uptrend line. if it's somehow could regain above the trend line again and maintain above the trend line is more likely the trend would continue and vice versa if the opposite do happen.
- Blue line is a previous higher high during december 2017 level.
- Orange line is golden fib ratio (fib sequence x 1.618) which act as an important consolidation area.
this is a 2 hour chart somehow cannot display the chart very well so this is for the wholesome chart looks like.
peace...
Note
Note
break out exactly on the yellow and blue fib circle that previously cause an impulse movement of BTC.D on the past time..for blue fib circle originated + yellow one
Disclaimer
The information and publications are not meant to be, and do not constitute, financial, investment, trading, or other types of advice or recommendations supplied or endorsed by TradingView. Read more in the Terms of Use.
Disclaimer
The information and publications are not meant to be, and do not constitute, financial, investment, trading, or other types of advice or recommendations supplied or endorsed by TradingView. Read more in the Terms of Use.