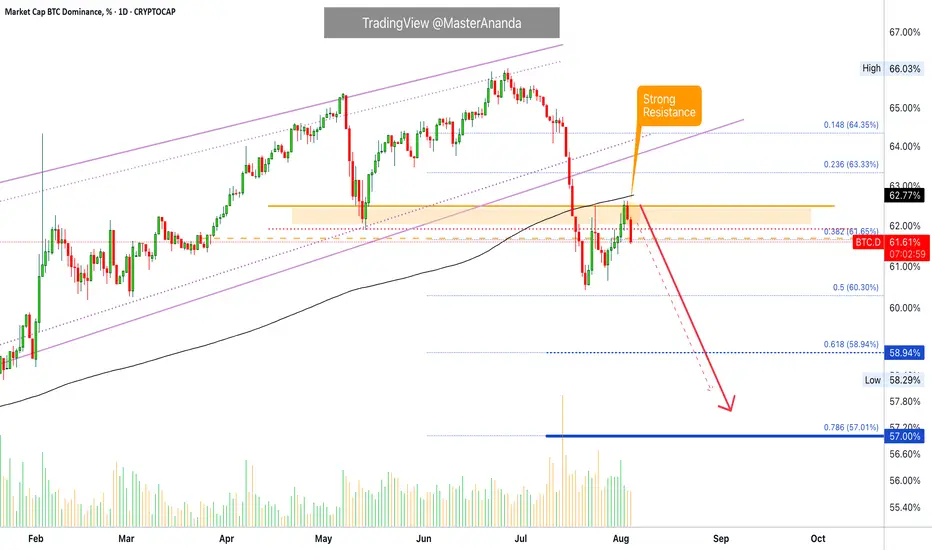
The rejection is happening right at "strong resistance." Notice that this is the same drawing from my previous update so it was drawn before the fact. Since resistance has been confirmed and the action is happening just as we expected, we can continue to follow our map as it is working.
The next logical move is a drop on Bitcoin Dominance Index (BTC.D), which translates into the resumption of the bullish wave for the altcoins, specially Ethereum and the big projects. It can also signal that Bitcoin will stop dropping and will either consolidate or move higher. This index reveals more than anything else the expected directions of the altcoins.
The retrace is over
The altcoins produced a retrace mainly between 21-July and the 2nd of August. In this period we saw many of the altcoins we are buying and holding move lower but only to produce a strong higher low. This higher low now will resolve into a very strong bullish wave, a bullish resumption.
Moving averages
Here MA200 daily has also been confirmed as resistance and trading below this indicator with a bearish bias, coming from a high point, gives out a very strong bearish signal. It means that long-term bearish action is now in place, the direction/trend. If the action was happening below MA200 but coming from a low point, this signal can have bullish connotations, right now it is bearish.
Bearish Bitcoin Dominance = Bullish Altcoins
The altcoins market will continue to grow, this is only the start. We are set to see growth long-term including now, next week, next month and until late 2025; maybe even for some portion of 2026, maybe even beyond.
Thank you for reading.
Namaste.
🚨 TOP FREE Trades
ETH +1450% · AAVE +1134%
XRP +749% · DOGS +868%
BTC +563% · SOL +658%
t.me/anandatrades/1350
🚨 FREE Analyses & New Results
t.me/masteranandatrades/6499
🚨 PREMIUM LIFETIME (Since 2017)
lamatrades.com
ETH +1450% · AAVE +1134%
XRP +749% · DOGS +868%
BTC +563% · SOL +658%
t.me/anandatrades/1350
🚨 FREE Analyses & New Results
t.me/masteranandatrades/6499
🚨 PREMIUM LIFETIME (Since 2017)
lamatrades.com
Related publications
Disclaimer
The information and publications are not meant to be, and do not constitute, financial, investment, trading, or other types of advice or recommendations supplied or endorsed by TradingView. Read more in the Terms of Use.