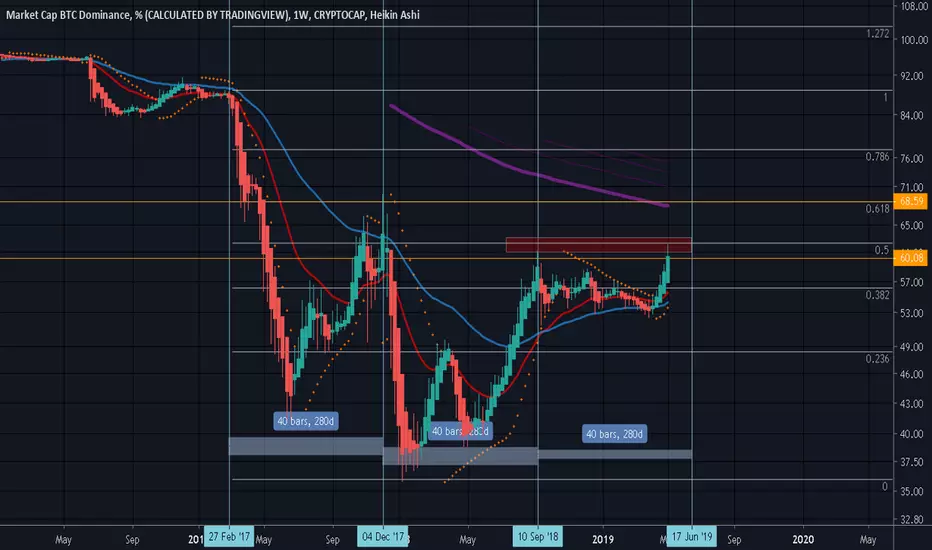
So far in weekly chart it's looking very bullish.. price action above Parabolic Sar dot indicate a bullish trend is in progress
if it's break 62%
expect a 68% become a next resistance.
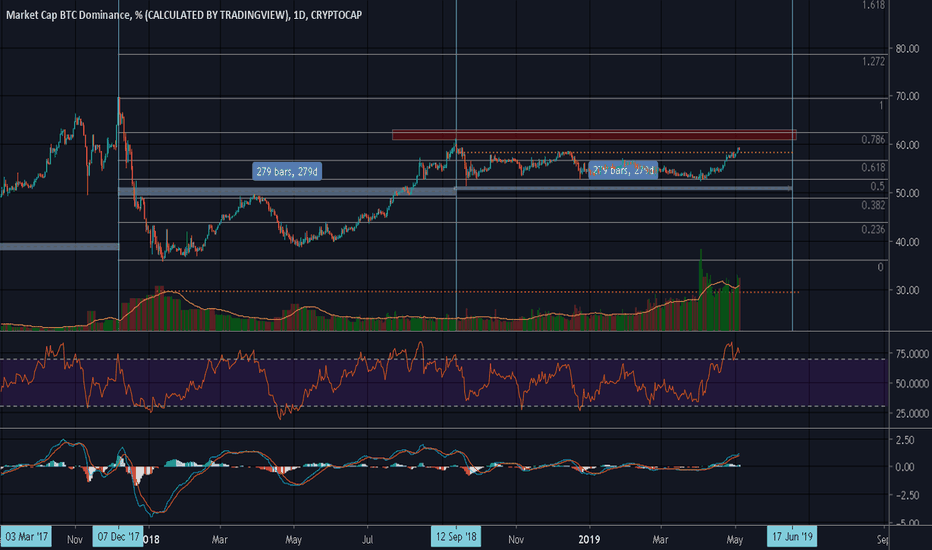
On Daily Chart it's looking bullish though the parabolic sar dot is closing in the candle in a tight range + it's in a resistance area 62 %.
a huge risk to trend shifting if the candle closes below 60% and a high possibility of retracement in daily chart..
For vertical line is a hypothetical date for it's starting to take a retracement based on previous correction movement after it's top price/precentage.
you can look into detail in this
please take this idea as a grain of salt as reality always differ from what i expect as this post merely just an opinion.
and please feel free to share what your thought on comment section.
peace.
Related publications
Disclaimer
The information and publications are not meant to be, and do not constitute, financial, investment, trading, or other types of advice or recommendations supplied or endorsed by TradingView. Read more in the Terms of Use.
Related publications
Disclaimer
The information and publications are not meant to be, and do not constitute, financial, investment, trading, or other types of advice or recommendations supplied or endorsed by TradingView. Read more in the Terms of Use.