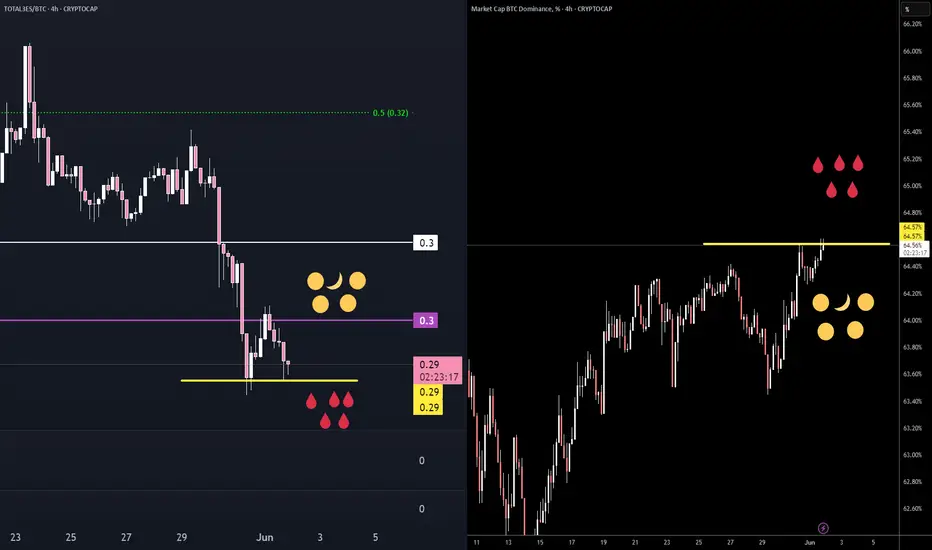
🔍 Left Chart – TOTAL3/BTC (Altcoins vs BTC)
Shows relative strength of altcoins vs. Bitcoin.
Currently at 0.29, retesting previous support (yellow line).
Clear breakdown from 0.30–0.32 zone, which was an important range.
🟥 Red drops at support = further altcoin weakness likely.
🟡 Moons/suns = former balance zone → now resistance.
This suggests altcoins are underperforming BTC—capital may be flowing back to Bitcoin (or out of the market).
🔍 Right Chart – BTC Dominance (% Market Cap)
BTC dominance is approaching the key 64.57% resistance level (yellow line).
If BTC dominance breaks out, it confirms capital rotating into BTC and away from altcoins.
🟥 Red drops above = a potential reversal/resistance zone—but if broken, altcoins may bleed more.
📊 Implication:
Altcoin vs BTC pair is weakening, while BTC dominance is strengthening.
This combo suggests a "Bitcoin-only" phase, often seen during risk-off periods.
Traders may prefer to rotate into BTC or stablecoins, avoiding alts for now.
Disclaimer
The information and publications are not meant to be, and do not constitute, financial, investment, trading, or other types of advice or recommendations supplied or endorsed by TradingView. Read more in the Terms of Use.
Disclaimer
The information and publications are not meant to be, and do not constitute, financial, investment, trading, or other types of advice or recommendations supplied or endorsed by TradingView. Read more in the Terms of Use.