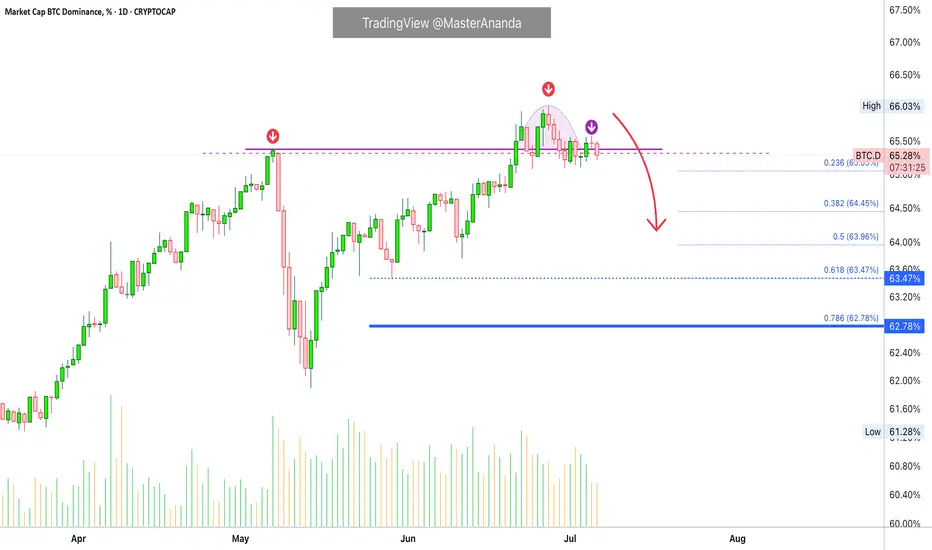
There is an interesting signal here on the daily Bitcoin Dominance index chart. Four days red. This signal has not happen since February and it is most certainly bearish.
After 26-June the index went red four days after hitting the highest reading since January 2021. This highest reading ended up producing a rounded top and the action moved back below the 7-May top which was the previous highest reading since 2021.
Now notice the purple line on the chart. This is the 7-May peak price. Yesterday, BTC.D was trading above this level but moved below today. The candle ended as a Doji, lower high and today turning bearish signals growing bearish momentum.
You can check the weekly timeframe for additional signals including the MACD and RSI. You can find it by visiting my profile MasterAnanda (Make sure to follow.)
In November 2024 BTC.D went extremely bearish and the entire altcoins market produced a major advance; Bitcoin also moved forward, the same can happen today. It is not certain the specific date, can be tomorrow, in a weeks time or within months... What is certain is that the bullish wave won't last as little as in April-May 2025 nor November-December 2024, both instances lasted only one month, this time around the bullish wave can last between 3-6 months.
Some pairs will grow straight up for months. Others will experience strong volatility but with a bullish bias. Marketwide bullish action. Bitcoin and the altcoins.
Thank you for reading.
Namaste.
🚨 TOP Results
ETH +2050% · AAVE +1134%
XRP +749% · DOGS +868%
BTC +580% · SOL +687%
t.me/anandatrades/1350
🚨 Analyses & Results
t.me/masteranandatrades/6681
🚨 LIFETIME (Pay for 7, get 1)
lamatrades.com —Since 2017
ETH +2050% · AAVE +1134%
XRP +749% · DOGS +868%
BTC +580% · SOL +687%
t.me/anandatrades/1350
🚨 Analyses & Results
t.me/masteranandatrades/6681
🚨 LIFETIME (Pay for 7, get 1)
lamatrades.com —Since 2017
Related publications
Disclaimer
The information and publications are not meant to be, and do not constitute, financial, investment, trading, or other types of advice or recommendations supplied or endorsed by TradingView. Read more in the Terms of Use.
