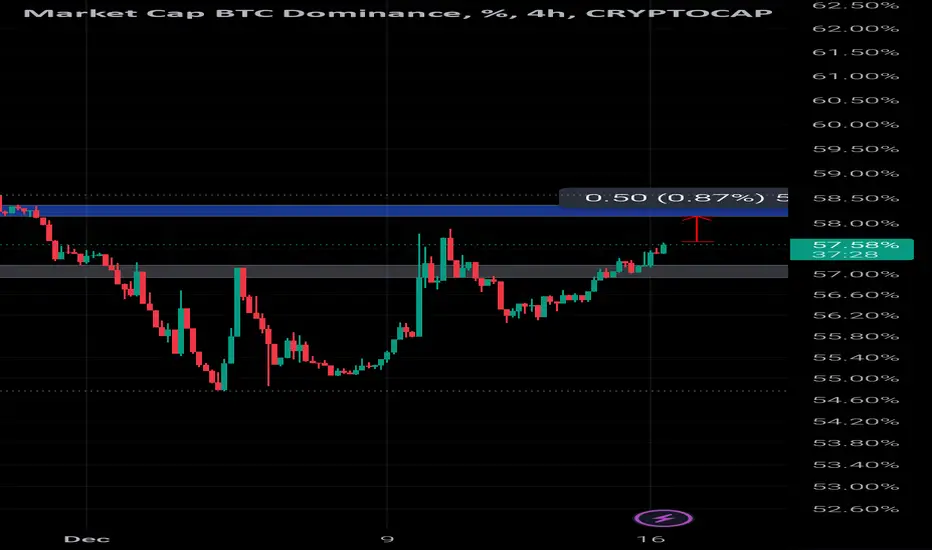
The chart shows BTC.D currently at 57.63%, approaching a key resistance zone (marked in blue) near 58%.
A breakout above this level could lead to a further rise in BTC.D, signaling continued Bitcoin dominance.
The area just below 58% has acted as resistance in the past, as seen on the chart.
If BTC.D hits 58.13% and rejects:
This could signal a shift of dominance back into altcoins, leading to a short-term altcoin rally.
Monitor key support zones for BTC.D (e.g., around 57%) for confirmation of a reversal.
If BTC.D breaks and holds above 58.13%:
Bitcoin may continue to dominate, and altcoins could face further corrections or stagnation.
Consider monitoring Bitcoin price for strength while keeping an eye on major altcoin support levels.
BTC.D Rising to 58.13%: Positive for Bitcoin, bearish for altcoins.
BTC.D Dumping After Hitting Resistance: Bullish for altcoins, indicating potential altcoin rotation or season.
Track BTC.D closely along with Bitcoin price movement to make informed decisions.
Disclaimer
The information and publications are not meant to be, and do not constitute, financial, investment, trading, or other types of advice or recommendations supplied or endorsed by TradingView. Read more in the Terms of Use.
Disclaimer
The information and publications are not meant to be, and do not constitute, financial, investment, trading, or other types of advice or recommendations supplied or endorsed by TradingView. Read more in the Terms of Use.