Join our community and start your crypto journey today for:
In-depth market analysis
Accurate trade setups
Early access to trending altcoins
Life-changing profit potential
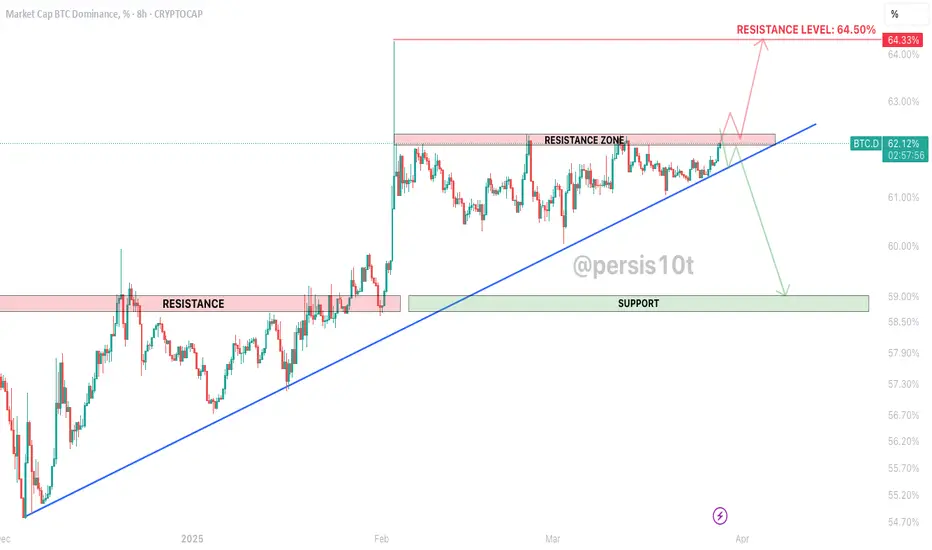
Let's analyze BTC dominance :
For four months, BTC dominance (BTC.D) has held a trendline support. After breaking out of an ascending triangle, BTC.D is forming another, with resistance at 62%-62.3%, repeatedly tested. A break above targets 64.50%, a strong resistance. Conversely, a trendline breakdown signals a potential drop to 59% support. Monitor these levels; a decisive break will heavily influence altcoin market dynamics.
Lower Support Levels:
59%-58.7%
Resistance Level:
62%-62.30%
64-50%
If you find this analysis helpful, please hit the like button to support my content! Share your thoughts in the comments, and feel free to request any specific chart analysis you’d like to see.
Happy Trading!!
In-depth market analysis
Accurate trade setups
Early access to trending altcoins
Life-changing profit potential
Let's analyze BTC dominance :
For four months, BTC dominance (BTC.D) has held a trendline support. After breaking out of an ascending triangle, BTC.D is forming another, with resistance at 62%-62.3%, repeatedly tested. A break above targets 64.50%, a strong resistance. Conversely, a trendline breakdown signals a potential drop to 59% support. Monitor these levels; a decisive break will heavily influence altcoin market dynamics.
Lower Support Levels:
59%-58.7%
Resistance Level:
62%-62.30%
64-50%
If you find this analysis helpful, please hit the like button to support my content! Share your thoughts in the comments, and feel free to request any specific chart analysis you’d like to see.
Happy Trading!!
Trade active
BTC dominance almost hit our 64.2% target, now eyeing a potential pullback towards 63%. This level could see a temporary drop. Crucially, BTC dominance is just above a key trendline. A break below this line could trigger a significant and rapid rally for altcoins.Disclaimer
The information and publications are not meant to be, and do not constitute, financial, investment, trading, or other types of advice or recommendations supplied or endorsed by TradingView. Read more in the Terms of Use.
Disclaimer
The information and publications are not meant to be, and do not constitute, financial, investment, trading, or other types of advice or recommendations supplied or endorsed by TradingView. Read more in the Terms of Use.