Let's examine  BTC #BTC
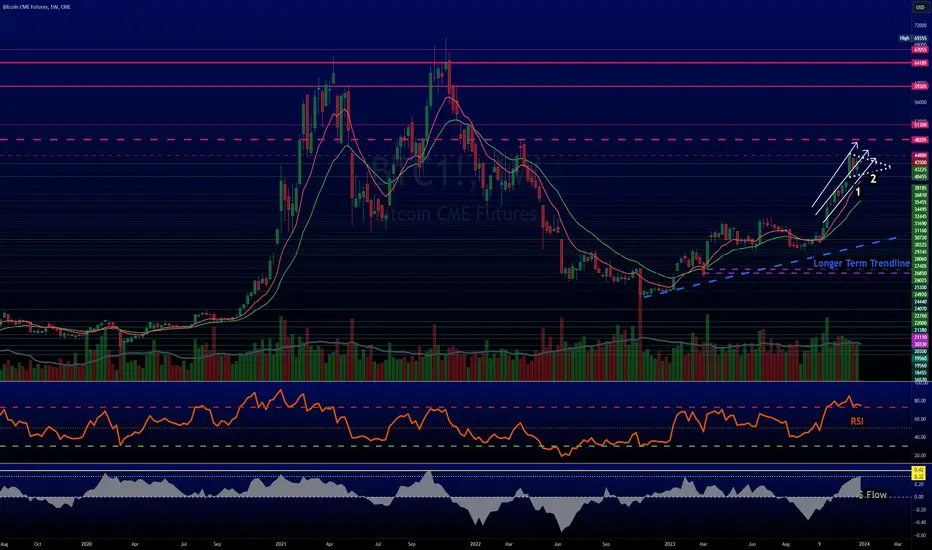
1 - it is still trading higher on that trendline, good news.
2 - it has formed a Symmetrical Triangle formation.
We've shown these before, best example was VIX, it cratered since the break.
These can really pack a punch. Have to keep an eye in the direction that they break, they do tend to be CONTINUATION patterns!!!
IMO #bitcoin could be setting up for 2024
PART 2
BTC WEEKLY:
RSI looks okay
Not exactly like mid 2019 or late 2020 but there's SOME resemblance.
#BTC $ flow looks pretty good.
If it stays here, historically it has a pause and then pushes higher
Then we reach the higher level, thick yellow line, where #bitcoin tends to peak.
1 - it is still trading higher on that trendline, good news.
2 - it has formed a Symmetrical Triangle formation.
We've shown these before, best example was
These can really pack a punch. Have to keep an eye in the direction that they break, they do tend to be CONTINUATION patterns!!!
IMO #bitcoin could be setting up for 2024
PART 2
RSI looks okay
Not exactly like mid 2019 or late 2020 but there's SOME resemblance.
#BTC $ flow looks pretty good.
If it stays here, historically it has a pause and then pushes higher
Then we reach the higher level, thick yellow line, where #bitcoin tends to peak.
Disclaimer
The information and publications are not meant to be, and do not constitute, financial, investment, trading, or other types of advice or recommendations supplied or endorsed by TradingView. Read more in the Terms of Use.
Disclaimer
The information and publications are not meant to be, and do not constitute, financial, investment, trading, or other types of advice or recommendations supplied or endorsed by TradingView. Read more in the Terms of Use.