https://tradingview.sweetlogin.com/x/J9kOHuqJ/
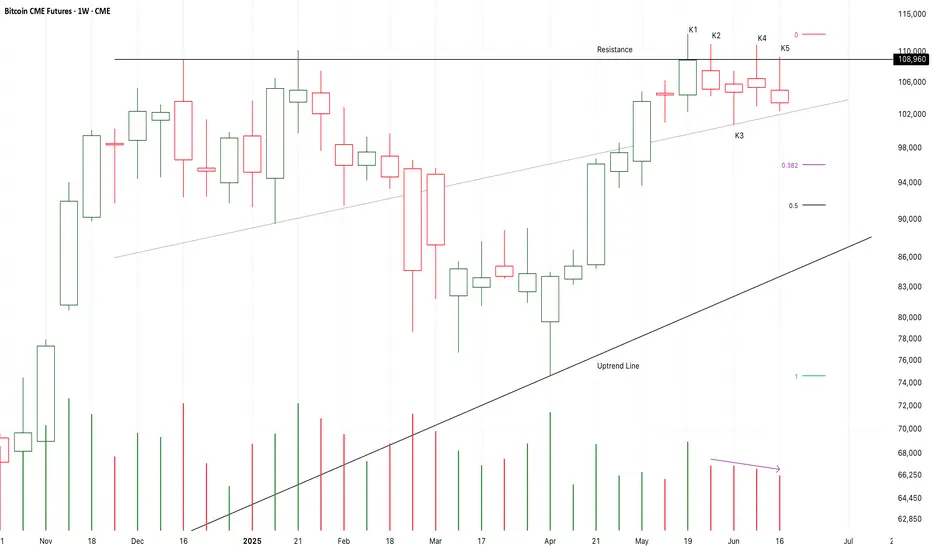
K5 close below K2,
It verified the resistance or the bear gap at K2.
It seems that the following candles will fall to test 0.382-0.5fib area.
I will try to buy it there.
I don’t think the three years bull market will be terminated here,
I am expecting another bull run to test or break up the resistance again.
On the other hand,
If K6 or the following candles finally close below 0.5fib line or the uptrend line,
A potential double top bear market will finally come up.
Long-96888/Stop-95888/Target-115K
Note
It seems that K2 is a weak fake down,
The market couldn’t accelerate immediately.
If K3 or the following candles successfully resets the downtrend line,
It will be a good place to short it here.
And then, a motive wave will push the market to the potential support.
I will try to buy it there.
On the other hand,
If K3 or the following candles break up the downtrend line or K1.
It is likely that another bull run will start here to test 112K area.
Short-103888/Stop-104888/Target-96.5K
Short-104248/Stop-105248/Target-96.5K
Disclaimer
The information and publications are not meant to be, and do not constitute, financial, investment, trading, or other types of advice or recommendations supplied or endorsed by TradingView. Read more in the Terms of Use.
Disclaimer
The information and publications are not meant to be, and do not constitute, financial, investment, trading, or other types of advice or recommendations supplied or endorsed by TradingView. Read more in the Terms of Use.