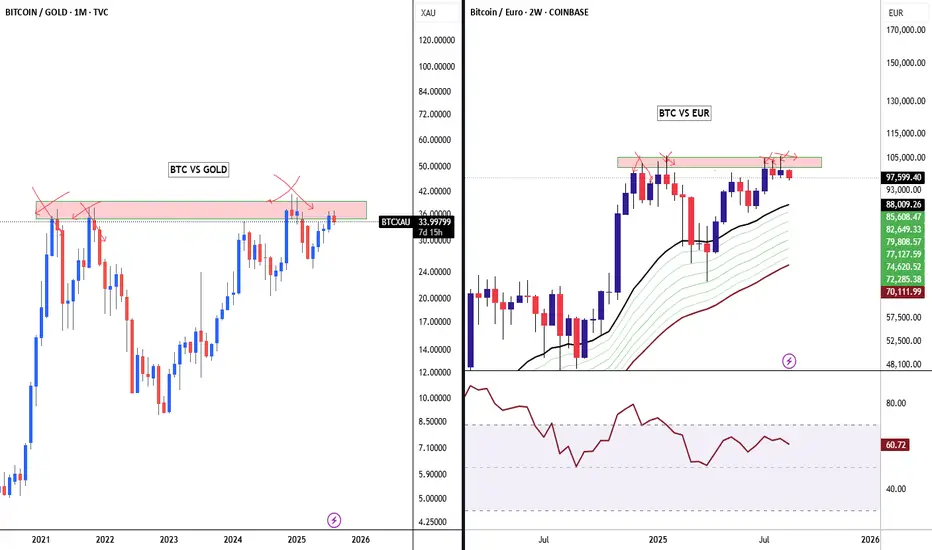
⚖️ BTC vs Gold (BTC/XAU) – 1M Chart
Observations:
• BTC/XAU is still below macro resistance (~36.0), which has acted as a multi-cycle ceiling since 2021.
• Every prior monthly rejection from this zone led to macro pullbacks in BTC.
• So far, this is the 4th monthly attempt to break through it — still no clean breakout.
RSI: Bearish divergence not obvious here, but clear rejection zone compression = potential energy build-up.
Implication:
• A monthly close > 36.0 BTC/XAU would mark first-ever breakout vs gold, signaling institutional capital may be favoring BTC over gold = massive macro signal.
⸻
💶 BTC vs EUR – 2W Chart
Observations:
• BTC/EUR is pressing into the macro ATH zone (~€104K–€106K), but still hasn’t broken above.
• Multiple rejections at this level since March 2024.
• 2W candles are consolidating tightly under resistance — typical pre-breakout coil if bulls take control.
EMA ribbon still rising steeply = trend support strong.
RSI: No bearish divergence, momentum still above 60 = healthy bullish pressure.
Implication:
• A breakout above ~€106K → confirms Euro ATH breakout, which could front-run or confirm USD ATH breakout.
• Especially powerful if paired with a breakout on the BTC/Gold chart.
⸻
🧠 What This Means for BTC/USDT (Macro Read)
✅ If BTC/EUR closes a 2W or monthly candle above ATH, and BTC/XAU confirms breakout above 36 →
🟢 BTC/USDT will likely follow with ATH breakout and possible parabolic extension.
Think of it as:
• BTC vs fiat (Euro) confirms capital rotation within currency systems.
• BTC vs hard assets (Gold) confirms rotation across store-of-value regimes.
If both flip → USDT-paired BTC becomes the laggard and is next to explode upward.
Observations:
• BTC/XAU is still below macro resistance (~36.0), which has acted as a multi-cycle ceiling since 2021.
• Every prior monthly rejection from this zone led to macro pullbacks in BTC.
• So far, this is the 4th monthly attempt to break through it — still no clean breakout.
RSI: Bearish divergence not obvious here, but clear rejection zone compression = potential energy build-up.
Implication:
• A monthly close > 36.0 BTC/XAU would mark first-ever breakout vs gold, signaling institutional capital may be favoring BTC over gold = massive macro signal.
⸻
💶 BTC vs EUR – 2W Chart
Observations:
• BTC/EUR is pressing into the macro ATH zone (~€104K–€106K), but still hasn’t broken above.
• Multiple rejections at this level since March 2024.
• 2W candles are consolidating tightly under resistance — typical pre-breakout coil if bulls take control.
EMA ribbon still rising steeply = trend support strong.
RSI: No bearish divergence, momentum still above 60 = healthy bullish pressure.
Implication:
• A breakout above ~€106K → confirms Euro ATH breakout, which could front-run or confirm USD ATH breakout.
• Especially powerful if paired with a breakout on the BTC/Gold chart.
⸻
🧠 What This Means for BTC/USDT (Macro Read)
✅ If BTC/EUR closes a 2W or monthly candle above ATH, and BTC/XAU confirms breakout above 36 →
🟢 BTC/USDT will likely follow with ATH breakout and possible parabolic extension.
Think of it as:
• BTC vs fiat (Euro) confirms capital rotation within currency systems.
• BTC vs hard assets (Gold) confirms rotation across store-of-value regimes.
If both flip → USDT-paired BTC becomes the laggard and is next to explode upward.
Disclaimer
The information and publications are not meant to be, and do not constitute, financial, investment, trading, or other types of advice or recommendations supplied or endorsed by TradingView. Read more in the Terms of Use.
Disclaimer
The information and publications are not meant to be, and do not constitute, financial, investment, trading, or other types of advice or recommendations supplied or endorsed by TradingView. Read more in the Terms of Use.