Candles at a Glance – Classic Indecision
Over the past few days, BTC has been printing mostly small-bodied candles with long upper and lower wicks — spinning tops and borderline doji territory. That’s textbook indecision, especially considering it’s happening just under a known resistance around EUR92,000.
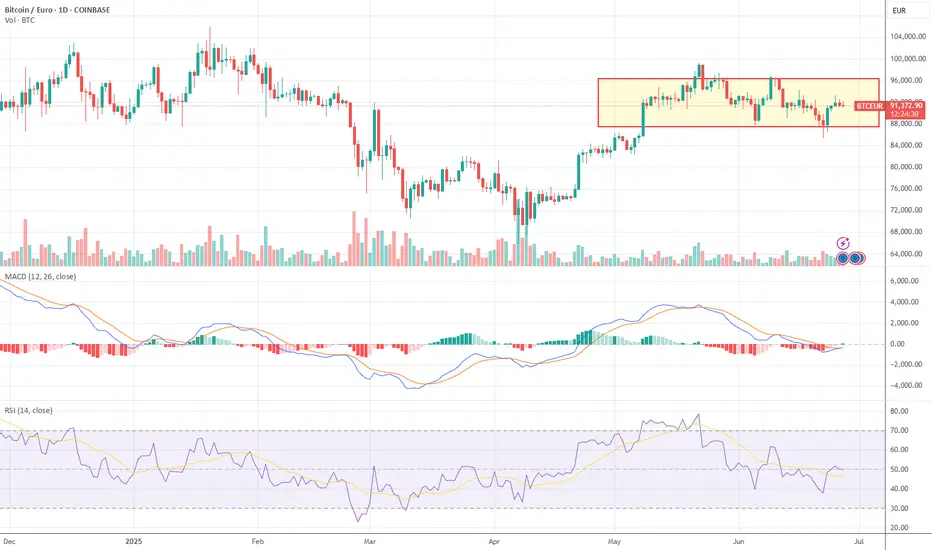
Zooming out a bit, we saw a bearish engulfing candle mid-June, right after a short-lived rally — a sign that sellers stepped in fast and took back control. Since then, no real bullish reversal patterns (like a hammer or morning star) have shown up, which makes it clear: buyers just aren’t stepping up with any conviction yet.
Takeaway: Price stalled after a weak bounce. No one’s taking the wheel right now.
Momentum Check
The broader uptrend that carried BTC from April into early June seems to be losing steam. Momentum indicators aren’t painting a strong picture:
MACD: Still showing a bearish crossover, with the histogram just flattening out — no momentum push either way.
RSI: Hovering around 46.6, below the 50 midline and drifting sideways.
Overall, there’s no panic, no euphoria — just quiet distribution. Classic "slow bleed" setup.
Takeaway: Trend looks tired. We’re probably in the middle of a sideways chop, not a trending environment.
Trading Box
BTC’s been trading inside a range since early May — roughly EUR88K to EUR96K. Price recently got smacked down near the upper boundary and is now drifting around the middle-lower part of the box. Volume hasn’t picked up on either side, which strengthens the case that we’re still stuck inside the box — no real breakout attempts yet.
Range:
Resistance: EUR96,000
Support: EUR88,000
Takeaway: Until BTC escapes this box with real volume, it’s just range-bound noise.
Fibonacci Levels to Know
Using the swing low near EUR60K and the high around EUR96K, here’s what matters:
Retracement Zones (if it breaks lower):
23.6% → EUR87,504
38.2% → EUR81,344
50.0% → EUR78,000
61.8% → EUR74,656
78.6% → EUR69,984
Extension Targets (if it breaks higher):
100% → EUR96,000
127.2% → EUR106,416
161.8% → EUR118,248
200% → EUR132,000
Current price? ~EUR91,400 — above the shallow retrace (23.6%) but well under the high. Basically... stuck.
Takeaway: Unless we see a push through EUR96K on volume, upside targets remain out of reach.
Trade Setup – Watching for a Trap
This is a textbook range trap setup. Price is stuck in a box, and while bulls are trying to hold the lower third, they’re not getting traction. Bears aren’t pressing either — it’s passive distribution, not aggressive selling.
Key Levels:
Resistance: EUR96K → Break + volume needed.
Support: EUR88K → Below here, EUR81K comes fast.
Trade Trigger: Volume spike + MACD/RSI confirmation — otherwise, it's just noise.
TL;DR Trade Edge
Bias: Neutral to slightly bearish
Strategy: Sit tight. Don’t chase in the middle of the range.
Watch for: Traps or fades near EUR96K or EUR88K
Need a real catalyst: Clean breakout with volume + momentum confirmation
Over the past few days, BTC has been printing mostly small-bodied candles with long upper and lower wicks — spinning tops and borderline doji territory. That’s textbook indecision, especially considering it’s happening just under a known resistance around EUR92,000.
Zooming out a bit, we saw a bearish engulfing candle mid-June, right after a short-lived rally — a sign that sellers stepped in fast and took back control. Since then, no real bullish reversal patterns (like a hammer or morning star) have shown up, which makes it clear: buyers just aren’t stepping up with any conviction yet.
Takeaway: Price stalled after a weak bounce. No one’s taking the wheel right now.
Momentum Check
The broader uptrend that carried BTC from April into early June seems to be losing steam. Momentum indicators aren’t painting a strong picture:
MACD: Still showing a bearish crossover, with the histogram just flattening out — no momentum push either way.
RSI: Hovering around 46.6, below the 50 midline and drifting sideways.
Overall, there’s no panic, no euphoria — just quiet distribution. Classic "slow bleed" setup.
Takeaway: Trend looks tired. We’re probably in the middle of a sideways chop, not a trending environment.
Trading Box
BTC’s been trading inside a range since early May — roughly EUR88K to EUR96K. Price recently got smacked down near the upper boundary and is now drifting around the middle-lower part of the box. Volume hasn’t picked up on either side, which strengthens the case that we’re still stuck inside the box — no real breakout attempts yet.
Range:
Resistance: EUR96,000
Support: EUR88,000
Takeaway: Until BTC escapes this box with real volume, it’s just range-bound noise.
Fibonacci Levels to Know
Using the swing low near EUR60K and the high around EUR96K, here’s what matters:
Retracement Zones (if it breaks lower):
23.6% → EUR87,504
38.2% → EUR81,344
50.0% → EUR78,000
61.8% → EUR74,656
78.6% → EUR69,984
Extension Targets (if it breaks higher):
100% → EUR96,000
127.2% → EUR106,416
161.8% → EUR118,248
200% → EUR132,000
Current price? ~EUR91,400 — above the shallow retrace (23.6%) but well under the high. Basically... stuck.
Takeaway: Unless we see a push through EUR96K on volume, upside targets remain out of reach.
Trade Setup – Watching for a Trap
This is a textbook range trap setup. Price is stuck in a box, and while bulls are trying to hold the lower third, they’re not getting traction. Bears aren’t pressing either — it’s passive distribution, not aggressive selling.
Key Levels:
Resistance: EUR96K → Break + volume needed.
Support: EUR88K → Below here, EUR81K comes fast.
Trade Trigger: Volume spike + MACD/RSI confirmation — otherwise, it's just noise.
TL;DR Trade Edge
Bias: Neutral to slightly bearish
Strategy: Sit tight. Don’t chase in the middle of the range.
Watch for: Traps or fades near EUR96K or EUR88K
Need a real catalyst: Clean breakout with volume + momentum confirmation
Disclaimer
The information and publications are not meant to be, and do not constitute, financial, investment, trading, or other types of advice or recommendations supplied or endorsed by TradingView. Read more in the Terms of Use.
Disclaimer
The information and publications are not meant to be, and do not constitute, financial, investment, trading, or other types of advice or recommendations supplied or endorsed by TradingView. Read more in the Terms of Use.