Hi Traders,
Looking at this current level, I believe it will hold and hence I'm publishing this.
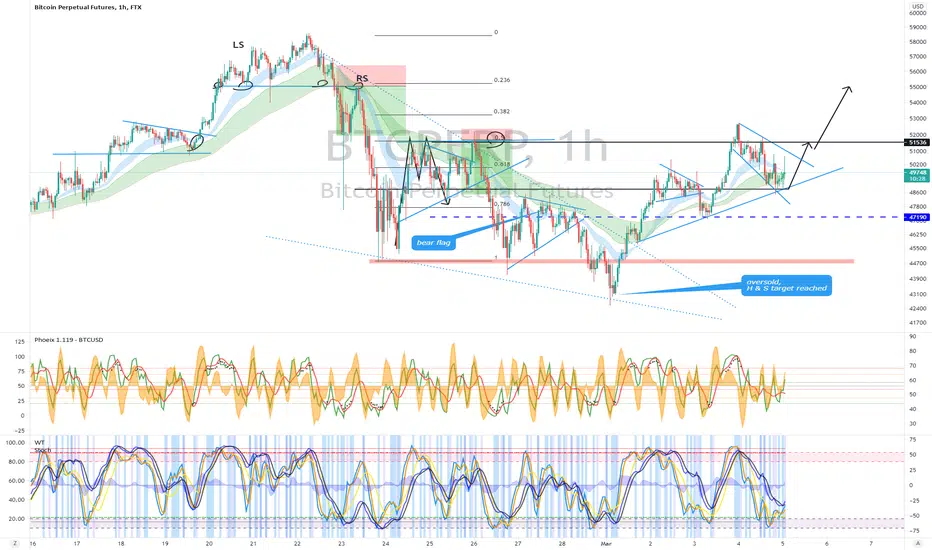
However you can see a bearish divergence will hold it back once it hits its target.
Just quickly, if you play this foreword, you will see where price held and why its bullish.
For now, the 1 hour chart is holding the trend and is a good way to gage entry.
It will likely hit the short term target and that will hopefully have a daily candle close above the 49k mark, showing another day where price closes above this level.
> 20 daily Ema > we need a daily to open and close above it others it acts like a resistance level.
Ideally we want to see a daily open and close candle above this, but necessary.
When to be concerned, stay bullish until >
================================================================
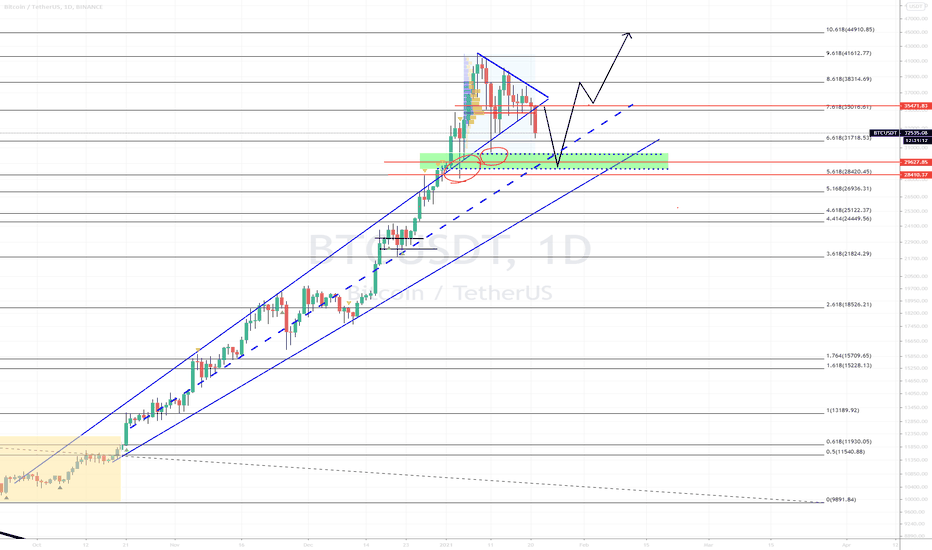
When to be concerned, If the monthly candle closes below 39k
Weekly chart, if it weekly candle closes below 49k
Al the best,
S.SAri


PREVIOUS POST
Looking at this current level, I believe it will hold and hence I'm publishing this.
However you can see a bearish divergence will hold it back once it hits its target.
Just quickly, if you play this foreword, you will see where price held and why its bullish.
For now, the 1 hour chart is holding the trend and is a good way to gage entry.
It will likely hit the short term target and that will hopefully have a daily candle close above the 49k mark, showing another day where price closes above this level.
> 20 daily Ema > we need a daily to open and close above it others it acts like a resistance level.
Ideally we want to see a daily open and close candle above this, but necessary.
When to be concerned, stay bullish until >
================================================================
When to be concerned, If the monthly candle closes below 39k
Weekly chart, if it weekly candle closes below 49k
Al the best,
S.SAri
PREVIOUS POST
Note
The Bearish scenarioNote
this old chart could still be applicable.Note
As stated, if we lose the 49k on the daily, we are heading down to retest a support level, as per above chart.Note
Note
Note
Note
Note
we hit the next resistance layer, 51kNote
Note
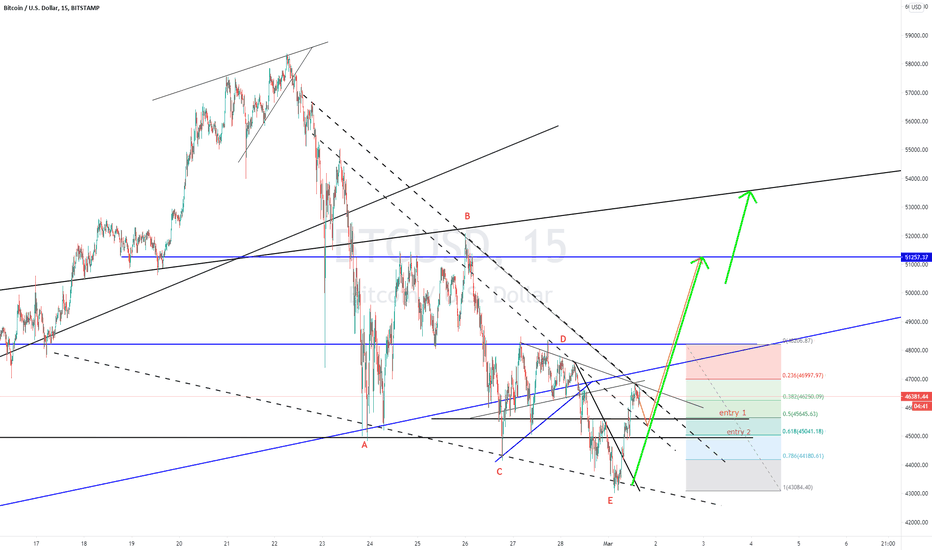
We have an ascending triangle on the left with the red zone as the main resistance at 52200. Later today it broke it and now a likely major support level.The chart on the right, shows a parallel channel and within that, a consolidation area represented by another downward channel and we are seeing its top level acting as support and finding resistance by the red band.
Note
Discord: discord.com/invite/vb4hbP88vb (TradeToProspa)
Telegram: t.me/TprospaTradersbot
This community has signals now but with no risk management comms.
Telegram: t.me/TprospaTradersbot
This community has signals now but with no risk management comms.
Related publications
Disclaimer
The information and publications are not meant to be, and do not constitute, financial, investment, trading, or other types of advice or recommendations supplied or endorsed by TradingView. Read more in the Terms of Use.