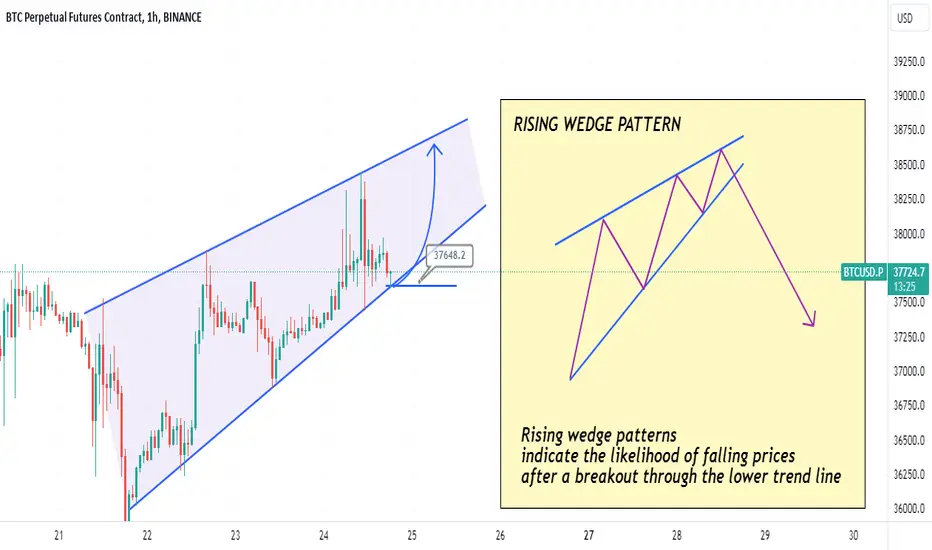
Try to enter one more bullish wave before this pattern broken down its not a wise decision, because rising wedge is one of the danger pattern in bullish wave,
many times this pattern break down and create a strong bearish.
I will update this analysis if I found a new pattern,
make sure you support this analysis to get update notification
if you have any question,
do not hesitate to DM.
Note
You can see that in this wave, pattern support easily to break down, and even if I will update this analysis at *pump and dump post about 1 hour before dump.
Note
If you only use chart patterns, during this analysis I made it of course with a bullish tagline, because it just touched support and was in a good bullish position. However, there are several technicalities beyond technical analysis that make me conclude that a dump will occur, moreover that this support is Fibonacci support which touches the trendline.Note
BTC break down triangle pattern, and dump start..
Note
T_T sad to see BTC like this,..its already 7 hours without any green candle.
But I'm happy because I read this movement 1 day before dump begin ^_^
Note
almost all crypto in 100 market cap list in a red zone right now T_TNote
it's already 1.45 A.Malready sleepy,
see u tmrw
Note
Our little dump It's only a correction of bullish wave inside a big channel up.Note
and if we look at bigger time frame, that small movement its only a wave inside bullish flag pattern.Note
Bearish end after reach fibonacci support.its bullish time
Trade closed: target reached
this analysis close, target bearish reach.See u at my next great analysis
I will post new BTC analysis tmrw if I found small pullback to re enter buy long position.
Bye all, thanks to all your support at this analysis.
Note
mornin all,I focused on analyzing ETH and forgot to analyze and post new analysis on BTC, my bad. Sorry ^^
From the previous chart we have an opening position near channel up support at $36,755
and it's approaching our target.
you can see that BTC also performing bullish flag here with profit projection at $39,493
Im lowering my target at $38,875 or any level at channel up resistance.
btw, for more than 7 days to come, I'm busy with my new online student schedule, so maybe I'm not active to update my analysis, at BTC, ETH or any alt coin.
See you all next week, bye.
If you have any question, DM for fast respond.
Note
pump BTC. we will reach target shortly. $39492sorry im not update with chart, because still busy here.
Note
bullish target at channel up resistance alredy reach,now its all depend on next candle. If we have bearish candle with full body under resistance line, bearish will perform to reach fibonacci 0.618
Note
20 like/support analysis on xrp,13 like/support analysis at Eth,
25 like/support analysis at BTC,...
still far from my target,
statically its bad.
maybe I should reduce my time to providing analysis, and its time to retired ^_^
or post analysis one a week without any update.
so this is my last update for this week,.
see u next week.
Bye
Disclaimer
The information and publications are not meant to be, and do not constitute, financial, investment, trading, or other types of advice or recommendations supplied or endorsed by TradingView. Read more in the Terms of Use.
Disclaimer
The information and publications are not meant to be, and do not constitute, financial, investment, trading, or other types of advice or recommendations supplied or endorsed by TradingView. Read more in the Terms of Use.