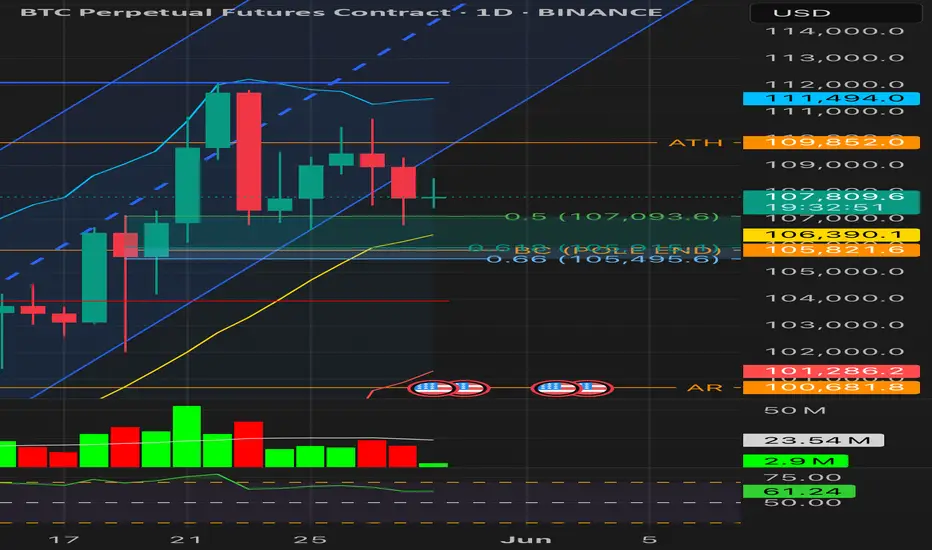
Bitcoin has now closed below the multi-week ascending trendline on the daily chart — the same trendline that defined the entire Phase D markup structure.
⸻
🔍 Breakdown Highlights:
📉 Daily Close: 107,764 → well below trendline ✅
🔻 Volume: 18.42M (near 20-day average) → not a panic candle, but confirms exit ✅
📉 Fibonacci Cluster: 0.5 (107,093) and 0.618 (105,495) now in play ✅
⚠️ RSI (14): 61.14 → still neutral, but diverging from price ❗
🧱 Next supports:
• 106,146 = BB basis
• 105,821 = BC Pole End
• 104,000 = Point of control from volume profile
⸻
🧩 Structural Impact (Wyckoff View):
• ❌ Trendline break = Phase D invalidated
• ❌ No breakout above ATH (109,852) after 3 attempts
• 🟠 Still not fully invalidated — if 105.8K holds, Spring-like scenario still possible
• 🔻 Close below 105.8K = Phase C fails → transition into Redistribution
⸻
⚠️ What to Watch Next:
• Bounce from 106.1–105.5K with volume could offer one last recovery setup
• A close below 105.8K confirms structural invalidation
⸻
🧠 Final Take:
The trendline break is real. Bulls need to defend the Fibonacci cluster + BC base around 105.8K. If that gives way, this becomes a failed reaccumulation and BTC risks a deeper structural rotation.
#Bitcoin #BTCUSDT #Breakdown #Trendline #TechnicalAnalysis #Wyckoff #BTC #CryptoMarkets #BTCdaily
⸻
🔍 Breakdown Highlights:
📉 Daily Close: 107,764 → well below trendline ✅
🔻 Volume: 18.42M (near 20-day average) → not a panic candle, but confirms exit ✅
📉 Fibonacci Cluster: 0.5 (107,093) and 0.618 (105,495) now in play ✅
⚠️ RSI (14): 61.14 → still neutral, but diverging from price ❗
🧱 Next supports:
• 106,146 = BB basis
• 105,821 = BC Pole End
• 104,000 = Point of control from volume profile
⸻
🧩 Structural Impact (Wyckoff View):
• ❌ Trendline break = Phase D invalidated
• ❌ No breakout above ATH (109,852) after 3 attempts
• 🟠 Still not fully invalidated — if 105.8K holds, Spring-like scenario still possible
• 🔻 Close below 105.8K = Phase C fails → transition into Redistribution
⸻
⚠️ What to Watch Next:
• Bounce from 106.1–105.5K with volume could offer one last recovery setup
• A close below 105.8K confirms structural invalidation
⸻
🧠 Final Take:
The trendline break is real. Bulls need to defend the Fibonacci cluster + BC base around 105.8K. If that gives way, this becomes a failed reaccumulation and BTC risks a deeper structural rotation.
#Bitcoin #BTCUSDT #Breakdown #Trendline #TechnicalAnalysis #Wyckoff #BTC #CryptoMarkets #BTCdaily
Trade closed: target reached
Protect your Bitcoin investment with our realtime alerts and fully automate your trading. No more sleepless nights, black swans, rug pulls, whale pump & dumps or getting sidelined.
Related publications
Disclaimer
The information and publications are not meant to be, and do not constitute, financial, investment, trading, or other types of advice or recommendations supplied or endorsed by TradingView. Read more in the Terms of Use.