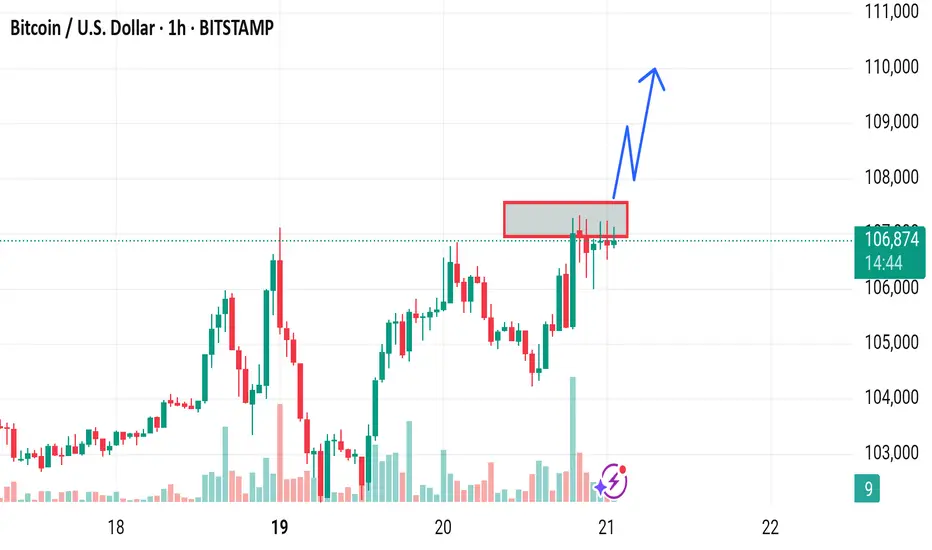
1. Overconfidence in Breakout:
The chart predicts a clean breakout, but the resistance zone has already been tested multiple times, indicating seller strength.
Disruption: Price might fake out above resistance and sharply reverse (bull trap).
2. Volume Confirmation Missing:
The breakout prediction lacks strong volume spike confirmation.
Disruption: Without increasing volume, any breakout attempt might fail and lead to a false breakout.
3. Short-Term RSI/Overbought Conditions (Not visible here):
If RSI or similar indicators are approaching overbought, it increases the chances of a pullback rather than immediate continuation.
4. Liquidity Sweep Risk:
Price may intentionally break the resistance to trigger stop-loss orders before reversing sharply (common in crypto markets).
Disruption: A stop-hunt move followed by a retrace to $105,000 or lower.
5. Macroeconomic or External Event Sensitivity:
If an external catalyst (e.g., Fed speech, ETF news, regulatory action) emerges, it can easily invalidate the bullish scenario.
Disclaimer
The information and publications are not meant to be, and do not constitute, financial, investment, trading, or other types of advice or recommendations supplied or endorsed by TradingView. Read more in the Terms of Use.
Disclaimer
The information and publications are not meant to be, and do not constitute, financial, investment, trading, or other types of advice or recommendations supplied or endorsed by TradingView. Read more in the Terms of Use.