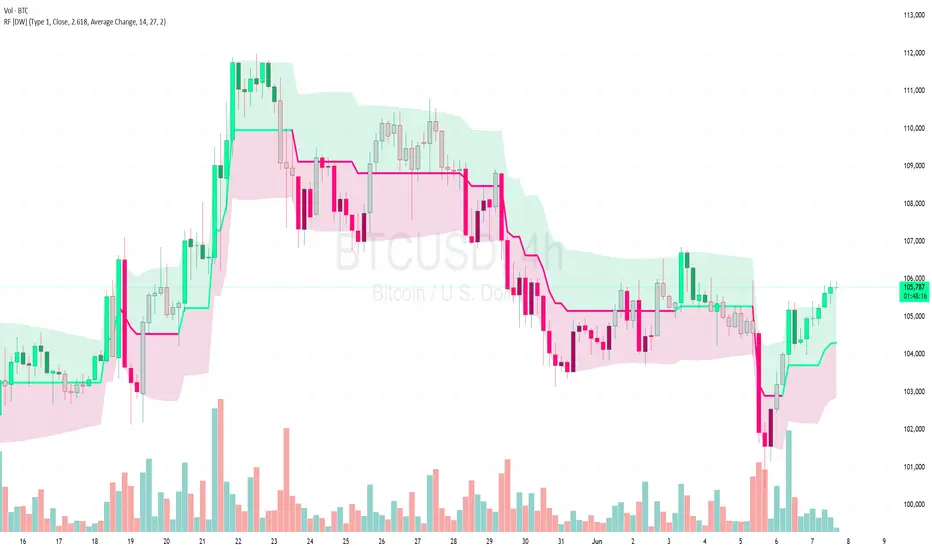
The following analysis is based on the BTC/USD 4-hour chart, utilizing the Range Filter Strategy indicator, as of June 7, 2025, 6:04 PM EDT. The chart reflects a recent trading range with notable price action and trading signals over the past few weeks.
Key observations:
The price has oscillated between a high of approximately 113,000 USD and a low of 104,000 USD, with the current level around 105,931 USD, showing a slight recovery from recent lows.
The Range Filter Strategy identifies long and short opportunities, with clear exit points. Notable long entries include a setup near 104,000 USD with an exit at 110,000 USD (marked as "Exit Long"), and another recent long signal around 105,000 USD with an ongoing upward move.
Short opportunities are indicated with exits at lower levels, such as the "Exit Short" near 107,000 USD, suggesting a profitable downward move.
The blue shaded areas represent the range filter, highlighting periods of consolidation and potential breakout zones. The recent drop from 110,000 USD to 105,000 USD was followed by a potential reversal, as indicated by the latest long signal.
Volume analysis at the bottom shows increased activity during breakout periods, supporting the validity of the signals.
Traders should watch for a sustained move above 107,000 USD to confirm bullish momentum, with resistance near 110,000 USD. A break below 104,000 USD could signal further downside.
Disclaimer: This analysis is for educational purposes only and not financial advice. Trading involves substantial risk, and past performance is not indicative of future results. Conduct your own research and consult a financial advisor before making trading decisions.
Join my trading community on Discord! 📈 Use all our indicators for FREE
discord.gg/xPEDcNEupw
discord.gg/xPEDcNEupw
Disclaimer
The information and publications are not meant to be, and do not constitute, financial, investment, trading, or other types of advice or recommendations supplied or endorsed by TradingView. Read more in the Terms of Use.