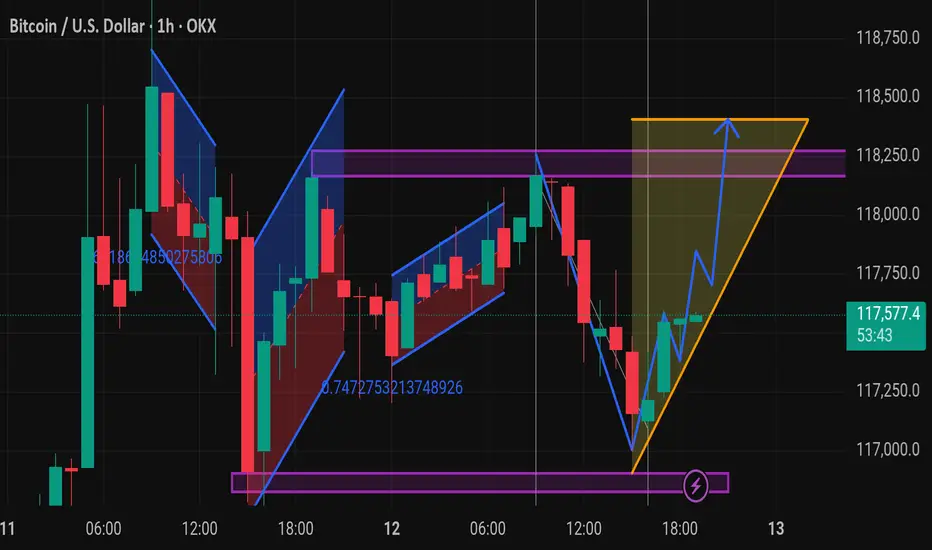
This chart displays the Bitcoin (BTC/USD) 1-hour candlestick chart on OKX, featuring a detailed technical analysis using harmonic patterns and chart structures.
Key Observations:
1. Harmonic Patterns:
Multiple harmonic/flag-like patterns are shown, both bullish and bearish.
These include retracements marked with Fibonacci ratios (e.g., 0.747 and 0.871), suggesting price reversal zones.
2. Support and Resistance:
Several horizontal purple lines indicate key support and resistance levels.
Strong support is visible around the 116,800 – 117,000 range.
Resistance appears near the 118,000 – 118,400 range.
3. Ascending Triangle Formation:
On the far right, an orange ascending triangle has formed, a typically bullish continuation pattern.
The blue arrow suggests a projected breakout to the upside, targeting around 118,400.
4. Bullish Reversal Indication:
A reversal (marked by a ⚡ icon) from the lower support zone around 117,000 seems to have initiated an upward move.
The zigzagging blue path shows a bullish scenario of higher highs and higher lows.
---
Summary:
The chart suggests bullish momentum building with a likely breakout from the ascending triangle pattern, targeting the 118,400 resistance level. Confirmation of the breakout would ideally come with strong volume and a close above 118,000.
Would you like a possible
🎯XAUUSD GOLD Daily 8-9 Free Signals🚀 World Best community Join Here ✅
💫XAUUSD
💫BTC
💫EURUSD
For Signals Telegram channel
⬇️⬇️⬇️⬇️⬇️⬇️⬇️⬇️⬇️⬇️⬇️⬇️⬇️
t.me/technicaltrader10
💫XAUUSD
💫BTC
💫EURUSD
For Signals Telegram channel
⬇️⬇️⬇️⬇️⬇️⬇️⬇️⬇️⬇️⬇️⬇️⬇️⬇️
t.me/technicaltrader10
Disclaimer
The information and publications are not meant to be, and do not constitute, financial, investment, trading, or other types of advice or recommendations supplied or endorsed by TradingView. Read more in the Terms of Use.