BTC/USD (Bitcoin vs USD)
Timeframe: 2-hour (2H)
Indicators: Ichimoku Cloud, Trendline, Support/Resistance zones
---
📊 Indicators Used
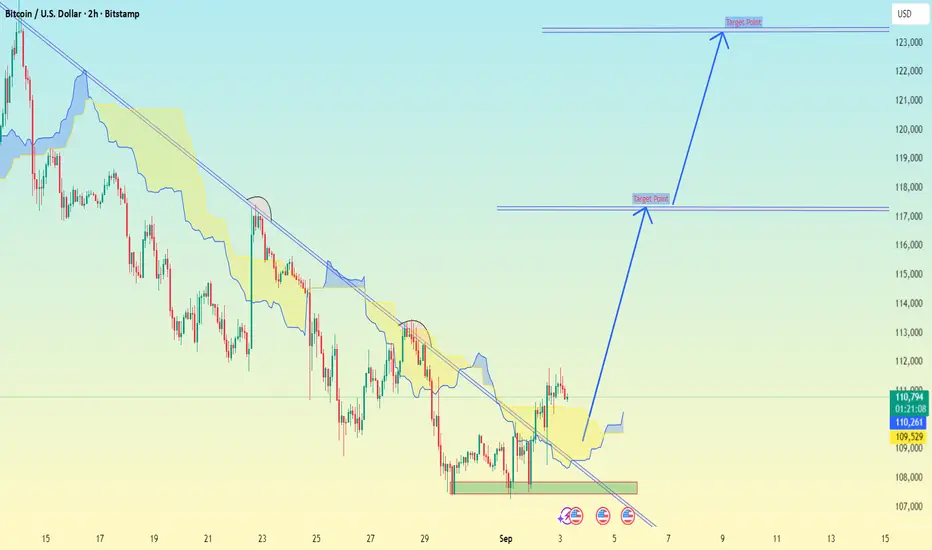
1. Ichimoku Cloud
Price recently broke above the descending trendline and is pushing into the cloud.
If it sustains above the cloud, that signals a potential trend reversal from bearish to bullish.
2. Support Zone (Green box)
Around 109,000 – 110,000 USD.
This is the base where buyers are stepping in.
3. Trendline Breakout
A downtrend line has been broken, suggesting the end of the short-term bearish momentum.
---
🎯 Targets (Based on my chart)
Target 1 (short-term): 117,173 USD
This is the first major resistance level.
Target 2 (medium-term): 123,000 USD
Next strong resistance zone and the final target marked on my chart.
---
⚠ Stop-Loss Suggestion
Below the support zone: ~108,500 – 109,000 USD
This protects against a false breakout.
---
✅ Summary
Breakout above downtrend line and moving into Ichimoku cloud = bullish signal.
First target: 117,173 USD
Second target: 123,000 USD
Stop-loss: Below 106,000 USD
Timeframe: 2-hour (2H)
Indicators: Ichimoku Cloud, Trendline, Support/Resistance zones
---
📊 Indicators Used
1. Ichimoku Cloud
Price recently broke above the descending trendline and is pushing into the cloud.
If it sustains above the cloud, that signals a potential trend reversal from bearish to bullish.
2. Support Zone (Green box)
Around 109,000 – 110,000 USD.
This is the base where buyers are stepping in.
3. Trendline Breakout
A downtrend line has been broken, suggesting the end of the short-term bearish momentum.
---
🎯 Targets (Based on my chart)
Target 1 (short-term): 117,173 USD
This is the first major resistance level.
Target 2 (medium-term): 123,000 USD
Next strong resistance zone and the final target marked on my chart.
---
⚠ Stop-Loss Suggestion
Below the support zone: ~108,500 – 109,000 USD
This protects against a false breakout.
---
✅ Summary
Breakout above downtrend line and moving into Ichimoku cloud = bullish signal.
First target: 117,173 USD
Second target: 123,000 USD
Stop-loss: Below 106,000 USD
Trade active
trade activet.me/forexofdollarsmagnet
Forex, gold and crypto signal's with detailed analysis & get consistent results..
t.me/+yJ2-qfkocRg1NDlk
Gold signal's with proper TP & SL for high profits opportunities..
Forex, gold and crypto signal's with detailed analysis & get consistent results..
t.me/+yJ2-qfkocRg1NDlk
Gold signal's with proper TP & SL for high profits opportunities..
Related publications
Disclaimer
The information and publications are not meant to be, and do not constitute, financial, investment, trading, or other types of advice or recommendations supplied or endorsed by TradingView. Read more in the Terms of Use.
t.me/forexofdollarsmagnet
Forex, gold and crypto signal's with detailed analysis & get consistent results..
t.me/+yJ2-qfkocRg1NDlk
Gold signal's with proper TP & SL for high profits opportunities..
Forex, gold and crypto signal's with detailed analysis & get consistent results..
t.me/+yJ2-qfkocRg1NDlk
Gold signal's with proper TP & SL for high profits opportunities..
Related publications
Disclaimer
The information and publications are not meant to be, and do not constitute, financial, investment, trading, or other types of advice or recommendations supplied or endorsed by TradingView. Read more in the Terms of Use.