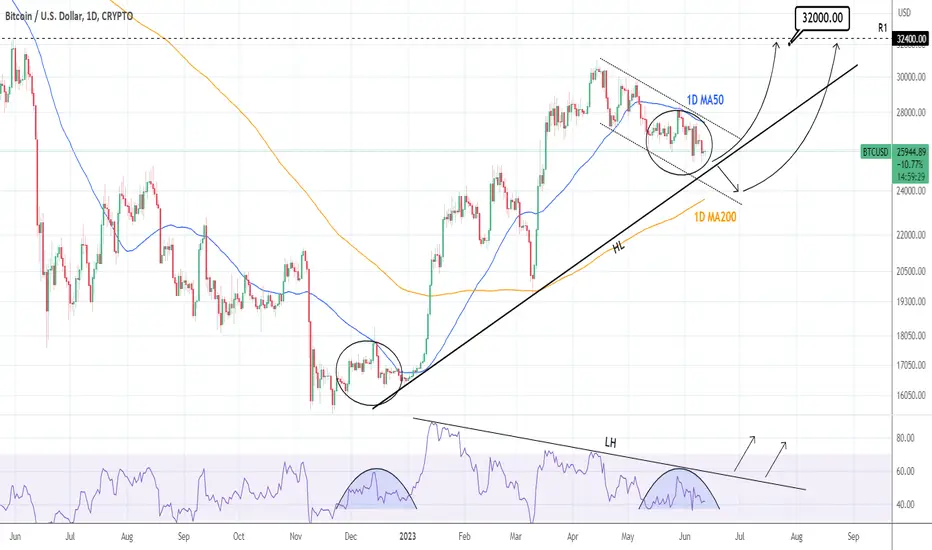
BTCUSD is technically on red indicators on the 1D time frame (RSI = 41.679, MACD = -426.400, ADX = 31.022) as it is inside a Channel Down pattern since April 14th and under the 1D MA50 since May 7th, but is near the HL trend line that is supporting throughout 2023.
There are high chances of holding this trend line so our strategy involves placing the first buy now and the second on the 1D MA200 in case the HL line breaks. The medium term target is the R1 (TP = 32,000).
Observe how the price action of the last month is much alike (also on the RSI) with that of December 2022, both under the 1D MA50. This bolsters the probabilities for a rebound. Additional validation will come after the RSI crosses over the LH trend line.
## If you like our free content follow our profile to get more daily ideas. ##
## Comments and likes are greatly appreciated. ##
Telegram: t.me/investingscope
investingscope.com
Over 65% accuracy on Private Signals Channel.
Over 15% return monthly on our Account Management Plan.
Account RECOVERY services.
Free Channel: t.me/investingscopeofficial
investingscope.com
Over 65% accuracy on Private Signals Channel.
Over 15% return monthly on our Account Management Plan.
Account RECOVERY services.
Free Channel: t.me/investingscopeofficial
Disclaimer
The information and publications are not meant to be, and do not constitute, financial, investment, trading, or other types of advice or recommendations supplied or endorsed by TradingView. Read more in the Terms of Use.