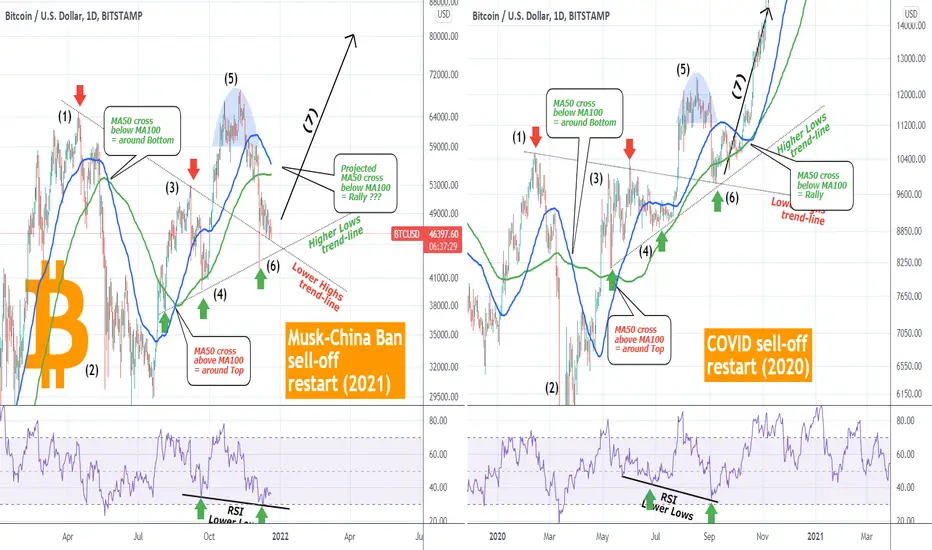
It's been prove that more often than not, fractals on Bitcoin work and consist a great deal of the analyses I publish here for TradingView's audience. Past/ historic behavior is a great way at making future projections and within these lines, I've prepared today's analysis too, by comparing this year's sell-off due to Musk/ China's ban and subsequent recovery to the 2020 COVID sell-off (and subsequent recovery).
I won't be getting into too much detail, but as you see by the markings and explanations I've plotted on the chart (1D time-frame), the two fractals are extremely similar:
a) The basic structure consists of a Lower Highs (red arrows) and a Higher Lows (green arrows) trend-line, which provide initially Resistance and then Support levels respectively.
b) When the MA50 (blue trend-line) crosses below the MA100 (green trend-line), BTC is around a Bottom. Similarly, when the MA50 crosses above the MA100, BTC is around a Top. The last MA50 crossing above the MA100 marked a rally (step 7) in mid October 2020.
c) The RSI bottoming sequences are also identical, marking a bottom on the last Lower Low of the trend-line (second green arrows), which is basically where we're at right now.
So based on this fractal do you expect BTCUSD to make a bottom soon and will the next 1D MA50 crossing above the 1D MA100 initiate a new parabolic rally?
Feel free to share your work and let me know in the comments section!
--------------------------------------------------------------------------------------------------------
Please like, subscribe and share your ideas and charts with the community!
--------------------------------------------------------------------------------------------------------
👑Best Signals (Forex/Crypto+70% accuracy) & Account Management (+20% profit/month on 10k accounts)
💰Free Channel t.me/tradingshotglobal
🤵Contact info@tradingshot.com t.me/tradingshot
🔥New service: next X100 crypto GEMS!
💰Free Channel t.me/tradingshotglobal
🤵Contact info@tradingshot.com t.me/tradingshot
🔥New service: next X100 crypto GEMS!
Disclaimer
The information and publications are not meant to be, and do not constitute, financial, investment, trading, or other types of advice or recommendations supplied or endorsed by TradingView. Read more in the Terms of Use.