🔄 Disrupted Analysis: Bullish Counter-Scenario
🧠 Original Bias:
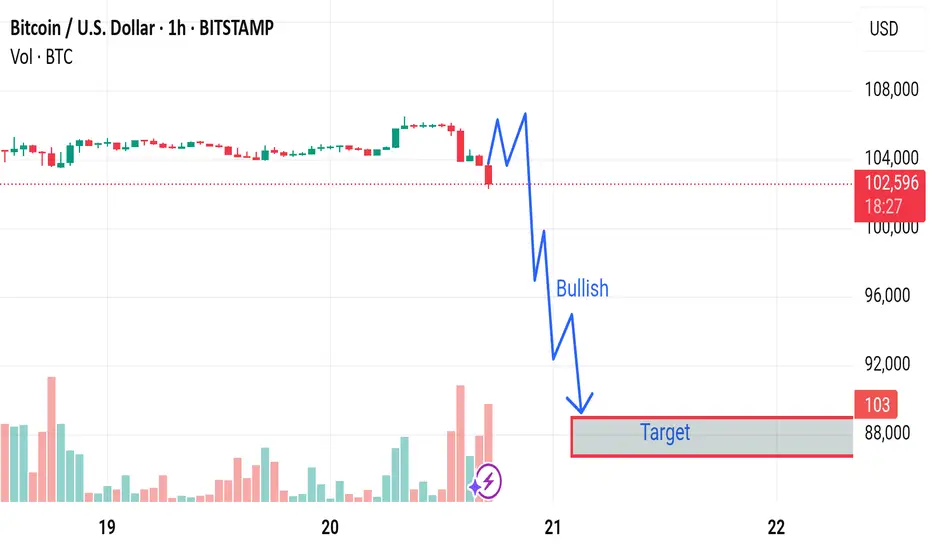
The chart predicts a strong bearish move, with a target around 88,000 USD.
The label "Bullish" seems misleading as it’s placed in a steep downward move.
---
📉 Issues With the Original Analysis:
1. Volume Misinterpretation:
Increasing red volume could indicate capitulation or a temporary panic sell-off, not necessarily the start of a new trend.
A bounce could follow if buyers step in.
2. Support Zone Ignored:
The analysis overlooks any previous support levels in the 100k–98k range, where buyers may be waiting.
3. No Confirmation for Breakdown:
The chart does not show a completed breakdown of a key structure or trendline.
The blue squiggle assumes a breakdown will happen, but no technical confirmation is visible.
---
📈 Disruption Scenario: Bullish Reversal Possible
Rejection from 102k zone could be a liquidity grab, not the start of a downtrend.
🧠 Original Bias:
The chart predicts a strong bearish move, with a target around 88,000 USD.
The label "Bullish" seems misleading as it’s placed in a steep downward move.
---
📉 Issues With the Original Analysis:
1. Volume Misinterpretation:
Increasing red volume could indicate capitulation or a temporary panic sell-off, not necessarily the start of a new trend.
A bounce could follow if buyers step in.
2. Support Zone Ignored:
The analysis overlooks any previous support levels in the 100k–98k range, where buyers may be waiting.
3. No Confirmation for Breakdown:
The chart does not show a completed breakdown of a key structure or trendline.
The blue squiggle assumes a breakdown will happen, but no technical confirmation is visible.
---
📈 Disruption Scenario: Bullish Reversal Possible
Rejection from 102k zone could be a liquidity grab, not the start of a downtrend.
t.me/gold_free_signals1
𝙁𝙤𝙧𝙚𝙭 𝙩𝙧𝙖𝙙𝙞𝙣𝙜 𝙚𝙭𝙥𝙚𝙧𝙞𝙚𝙣𝙘𝙚 𝙩𝙚𝙖𝙢 ☺️ 𝙢𝙖𝙣𝙖𝙜𝙚 𝙮𝙤𝙪𝙧 𝙖𝙘𝙘𝙤𝙪𝙣𝙩 𝙢𝙖𝙠𝙞𝙣𝙜 𝙢𝙤𝙣𝙚𝙮 🤑💰
t.me/gold_free_signals1
𝙁𝙤𝙧𝙚𝙭 𝙩𝙧𝙖𝙙𝙞𝙣𝙜 𝙚𝙭𝙥𝙚𝙧𝙞𝙚𝙣𝙘𝙚 𝙩𝙚𝙖𝙢 ☺️ 𝙢𝙖𝙣𝙖𝙜𝙚 𝙮𝙤𝙪𝙧 𝙖𝙘𝙘𝙤𝙪𝙣𝙩 𝙢𝙖𝙠𝙞𝙣𝙜 𝙢𝙤𝙣𝙚𝙮 🤑💰
t.me/gold_free_signals1
Disclaimer
The information and publications are not meant to be, and do not constitute, financial, investment, trading, or other types of advice or recommendations supplied or endorsed by TradingView. Read more in the Terms of Use.
t.me/gold_free_signals1
𝙁𝙤𝙧𝙚𝙭 𝙩𝙧𝙖𝙙𝙞𝙣𝙜 𝙚𝙭𝙥𝙚𝙧𝙞𝙚𝙣𝙘𝙚 𝙩𝙚𝙖𝙢 ☺️ 𝙢𝙖𝙣𝙖𝙜𝙚 𝙮𝙤𝙪𝙧 𝙖𝙘𝙘𝙤𝙪𝙣𝙩 𝙢𝙖𝙠𝙞𝙣𝙜 𝙢𝙤𝙣𝙚𝙮 🤑💰
t.me/gold_free_signals1
𝙁𝙤𝙧𝙚𝙭 𝙩𝙧𝙖𝙙𝙞𝙣𝙜 𝙚𝙭𝙥𝙚𝙧𝙞𝙚𝙣𝙘𝙚 𝙩𝙚𝙖𝙢 ☺️ 𝙢𝙖𝙣𝙖𝙜𝙚 𝙮𝙤𝙪𝙧 𝙖𝙘𝙘𝙤𝙪𝙣𝙩 𝙢𝙖𝙠𝙞𝙣𝙜 𝙢𝙤𝙣𝙚𝙮 🤑💰
t.me/gold_free_signals1
Disclaimer
The information and publications are not meant to be, and do not constitute, financial, investment, trading, or other types of advice or recommendations supplied or endorsed by TradingView. Read more in the Terms of Use.