Hello investors.
I repost and re-edit my chart multiple times to be updated.
Take this one as long-term based on daily time frame.
I think, crisis ain't done and the worst will come yet.
We can spot a lot of similarities with 2008, when
Bitcoin does not exist. It is on SP500 chart.
To make is simple I let bars pattern in chart as an example:
It would happen very soon, probably with start in this May ( traditional "Sell in May and go away" ).
Don't read news if wave is done.
This rally was suspicious from its beginning and only made Lehman formation.
I don't expect much upsides - to be clear.
I am just a passenger as you. So let's wait and see.
My belt is fasten already ;-)
With care always,
Emvo.
Note
Let's wait if the Diamond confirms top.Note
Diamond broke down and approaching 200 weekly MA. Break below will confirm further down trend especially.Note
200 weekly ( green line ) is holding. If some upside exists, it will be a new top around that red average ( 100weekly).Note
June should be sideways/bearish.Note
Forming into orange triangleNote
There is some confirmation already at breakdown. Not very profitable period for holding as appears to me :
Note
Some space for return remains. However I don' see much-less reasons for upside.
Note
Not closed, but another lower low:Note
Retesting orange triangle. Weekly close was below:Note
Back into triangle: Note
If BTC get about red line high, it will invalidate this analysis:Note
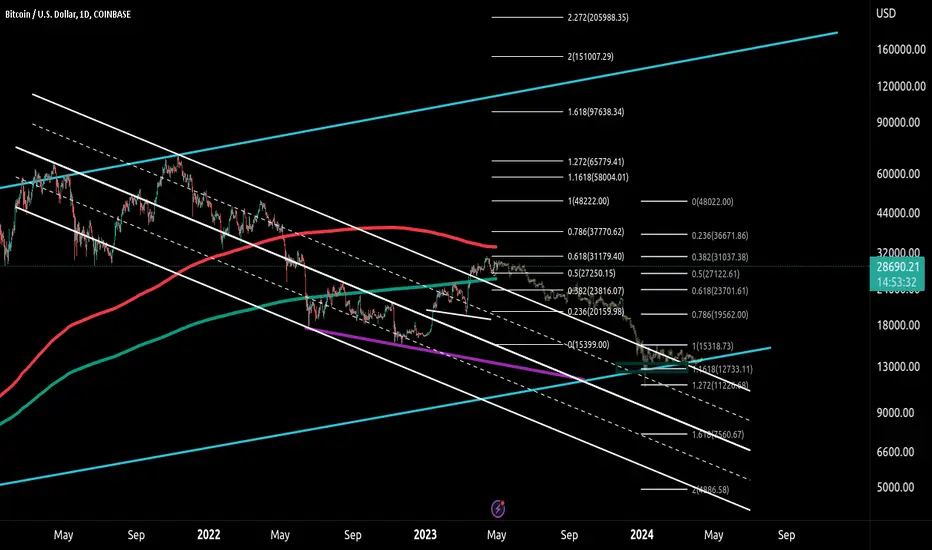
Zoom out insight on Fibos: Note
Still just higher low, but will see :Note
If bull flat play out, 35k and new TA is possible :vNote
Order cancelled
Note
Some of struggle below high still. Time will show :Note
I am curious how this ends :Disclaimer
The information and publications are not meant to be, and do not constitute, financial, investment, trading, or other types of advice or recommendations supplied or endorsed by TradingView. Read more in the Terms of Use.
Disclaimer
The information and publications are not meant to be, and do not constitute, financial, investment, trading, or other types of advice or recommendations supplied or endorsed by TradingView. Read more in the Terms of Use.