Every major Bitcoin move over the last decade — whether a jaw-dropping bull run or a brutal crash — has shared one silent macro trigger.
It’s not the halving.
It’s not ETF hype.
It’s not Twitter sentiment or TikTok FOMO.
👉 It’s global liquidity.
And right now, this powerful force is expanding fast — the same setup that previously drove Bitcoin from $5K to $70K in under a year.
But here’s the twist: as of today, Bitcoin is already trading near $120,000, not $20K or 30k.
That means the engine is already roaring — and if this macro thesis holds, the next stop might just be $175,000-200.000 by year's end.
________________________________________
🧠 What Is Global Liquidity, Really?
Global liquidity = the total money sloshing around the financial system.
It’s often measured through M2 money supply, combining:
• Cash
• Checking/savings deposits
• Easily accessible liquid assets
The most comprehensive view comes from Global M2, which aggregates liquidity from 20 of the world’s largest central banks.
Right now, Global M2 is not just rising — it’s breaking to all-time highs.
And if history repeats itself, Bitcoin tends to follow this wave closely.
________________________________________
📅 Past Performance: Bitcoin and Liquidity Walk Hand in Hand
Let’s break it down:
• 2016–2017: Liquidity surges → BTC +5,000%
• 2020–2021: Post-COVID easing → BTC $5K to $69K
• 2018 & 2022: Liquidity dries up → BTC crashes ~70%
It’s a recurring pattern:
Liquidity drives the crypto cycle.
________________________________________
💡 Why Liquidity Moves: Interest Rates and Central Banks
Central banks control the tap.
• 🟢 Cut rates → Easier credit → More lending → More liquidity
• 🔴 Raise rates → Tighter credit → Less spending → Liquidity contraction
In 2022, the Fed tightened hard.
🧊 U.S. money supply shrank.
📉 Bitcoin fell from $70K to $15K.
But starting August 2023, the Fed paused, then pivoted.
Since then:
• 🟢 The U.S. M2 supply rebounded
• 🟢 Global M2 began expanding again
• 🟢 Over 64 global rate cuts were made in just six months — one of the fastest global easing cycles in history
The last time we saw this much cutting? 2020.
And we all know what happened to Bitcoin then.

U.S M2
________________________________________
🟢 Today’s Setup: The Engine Is Already Running
Fast forward to mid-July 2025:
Bitcoin is no longer at $30K — it’s already testing $120K.
Intraday highs have touched $123K, with a current consolidation zone between $117K–$120K.
This isn’t a "recovery rally" — we’re already in price discovery territory.
The question now becomes:
Is $150K and above next… or are we topping out?
________________________________________
📈 Charting the Path: Bitcoin vs Global M2
When we overlay Bitcoin price over global liquidity trends, one thing becomes crystal clear:
📊 Bitcoin tracks liquidity direction.
• When money supply expands, Bitcoin rallies.
• When money dries up, Bitcoin tanks.
Given that global M2 is at record highs, and liquidity conditions are easing globally, the chart suggests there’s still plenty of fuel in the tank.
And if we follow the same growth, Bitcoin could realistically reach $175,000 before 2026 kicks in.
________________________________________
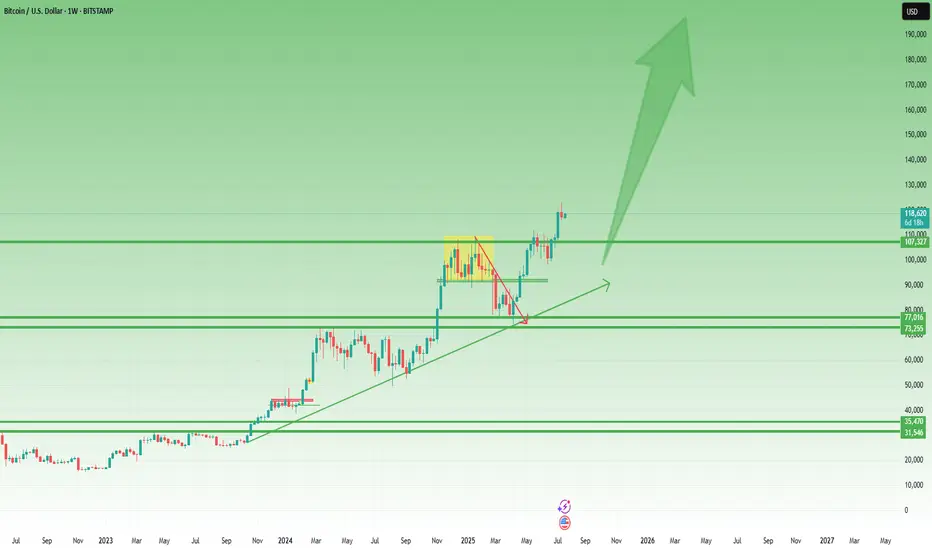
Technically:
As we can clearly see from the posted weekly chart, you don’t need to be an expert to recognize the strength of the current uptrend.
While last week printed a small bearish Pin Bar, this alone shouldn’t raise major concerns — especially considering the presence of multiple key support levels, starting from the 110K zone.
In the context of a strong and well-established trend, such candles often reflect normal short-term profit-taking, not a reversal.
🎯 Conclusion – Don’t Fight the Tide
This isn’t about hopium.
It’s not moon talk.
It’s about macro flows and monetary velocity.
Ignore the noise.
Watch what the central banks are doing.
Because Bitcoin moves not on wishful thinking, but on waves of liquidity — and the tide right now is rising fast.
Whether $175K comes by year-end, one thing is clear:
We are in the middle of a liquidity-driven expansion phase, and Bitcoin is already responding.
Stay focused, manage your risk, and don’t chase — ride the wave. 🌊
It’s not the halving.
It’s not ETF hype.
It’s not Twitter sentiment or TikTok FOMO.
👉 It’s global liquidity.
And right now, this powerful force is expanding fast — the same setup that previously drove Bitcoin from $5K to $70K in under a year.
But here’s the twist: as of today, Bitcoin is already trading near $120,000, not $20K or 30k.
That means the engine is already roaring — and if this macro thesis holds, the next stop might just be $175,000-200.000 by year's end.
________________________________________
🧠 What Is Global Liquidity, Really?
Global liquidity = the total money sloshing around the financial system.
It’s often measured through M2 money supply, combining:
• Cash
• Checking/savings deposits
• Easily accessible liquid assets
The most comprehensive view comes from Global M2, which aggregates liquidity from 20 of the world’s largest central banks.
Right now, Global M2 is not just rising — it’s breaking to all-time highs.
And if history repeats itself, Bitcoin tends to follow this wave closely.
________________________________________
📅 Past Performance: Bitcoin and Liquidity Walk Hand in Hand
Let’s break it down:
• 2016–2017: Liquidity surges → BTC +5,000%
• 2020–2021: Post-COVID easing → BTC $5K to $69K
• 2018 & 2022: Liquidity dries up → BTC crashes ~70%
It’s a recurring pattern:
Liquidity drives the crypto cycle.
________________________________________
💡 Why Liquidity Moves: Interest Rates and Central Banks
Central banks control the tap.
• 🟢 Cut rates → Easier credit → More lending → More liquidity
• 🔴 Raise rates → Tighter credit → Less spending → Liquidity contraction
In 2022, the Fed tightened hard.
🧊 U.S. money supply shrank.
📉 Bitcoin fell from $70K to $15K.
But starting August 2023, the Fed paused, then pivoted.
Since then:
• 🟢 The U.S. M2 supply rebounded
• 🟢 Global M2 began expanding again
• 🟢 Over 64 global rate cuts were made in just six months — one of the fastest global easing cycles in history
The last time we saw this much cutting? 2020.
And we all know what happened to Bitcoin then.
U.S M2
________________________________________
🟢 Today’s Setup: The Engine Is Already Running
Fast forward to mid-July 2025:
Bitcoin is no longer at $30K — it’s already testing $120K.
Intraday highs have touched $123K, with a current consolidation zone between $117K–$120K.
This isn’t a "recovery rally" — we’re already in price discovery territory.
The question now becomes:
Is $150K and above next… or are we topping out?
________________________________________
📈 Charting the Path: Bitcoin vs Global M2
When we overlay Bitcoin price over global liquidity trends, one thing becomes crystal clear:
📊 Bitcoin tracks liquidity direction.
• When money supply expands, Bitcoin rallies.
• When money dries up, Bitcoin tanks.
Given that global M2 is at record highs, and liquidity conditions are easing globally, the chart suggests there’s still plenty of fuel in the tank.
And if we follow the same growth, Bitcoin could realistically reach $175,000 before 2026 kicks in.
________________________________________
Technically:
As we can clearly see from the posted weekly chart, you don’t need to be an expert to recognize the strength of the current uptrend.
While last week printed a small bearish Pin Bar, this alone shouldn’t raise major concerns — especially considering the presence of multiple key support levels, starting from the 110K zone.
In the context of a strong and well-established trend, such candles often reflect normal short-term profit-taking, not a reversal.
🎯 Conclusion – Don’t Fight the Tide
This isn’t about hopium.
It’s not moon talk.
It’s about macro flows and monetary velocity.
Ignore the noise.
Watch what the central banks are doing.
Because Bitcoin moves not on wishful thinking, but on waves of liquidity — and the tide right now is rising fast.
Whether $175K comes by year-end, one thing is clear:
We are in the middle of a liquidity-driven expansion phase, and Bitcoin is already responding.
Stay focused, manage your risk, and don’t chase — ride the wave. 🌊
📈 Forex & XAU/USD Channel:
t.me/intradaytradingsignals
💎 Crypto Channel:
t.me/FanCryptocurrency
Related publications
Disclaimer
The information and publications are not meant to be, and do not constitute, financial, investment, trading, or other types of advice or recommendations supplied or endorsed by TradingView. Read more in the Terms of Use.