reflects key technical developments and potential breakout scenarios:
Description and Analysis:
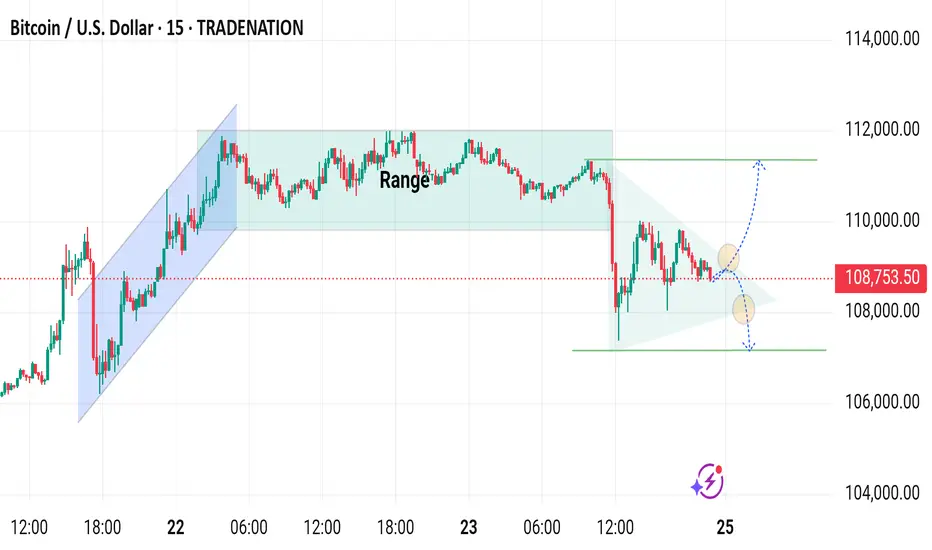
1. Previous Uptrend (Left Section):
The chart begins with a strong bullish trend forming a rising channel.
Candles within the channel show consistent higher highs and higher lows, reflecting strong buying momentum up to the peak near $112,000.
2. Range-Bound Movement (Middle Section):
After reaching the top of the channel, Bitcoin enters a consolidation phase.
The price fluctuates horizontally within a well-defined range between approximately $110,800 and $112,000.
Candlestick bodies become shorter with frequent wicks on both sides, indicating indecision and balance between buyers and sellers.
3. Bearish Breakdown:
A sharp bearish breakout follows, with a long red candle breaking down below the range support.
This marks a shift in sentiment as sellers gain control, driving the price down to around $107,800.
4. Symmetrical Triangle Formation (Right Section):
After the breakdown, price action begins to consolidate again in a symmetrical triangle, showing lower highs and higher lows.
This pattern typically precedes a breakout but doesn't indicate direction.
5. Current Scenario and Potential Breakouts:
Price is nearing the triangle's apex around $108,753.50, suggesting an imminent breakout.
Two scenarios are illustrated:
Bullish breakout: A move above the upper triangle boundary could drive price back toward the previous range resistance around $112,000.
Bearish breakout: A drop below the lower triangle support could lead to further decline toward the $106,000–105,000 area.
Candle Behavior:
High-volume red candles initiated the drop from the range.
Recent candles within the triangle are mixed and relatively small, hinting at consolidation and a battle for control.
Volume contraction supports the idea of a potential breakout setup.
Conclusion:
BTC/USD is currently at a critical juncture. Traders should watch for a decisive breakout from the symmetrical triangle, as it could determine the short-term direction—either a recovery toward previous highs or continuation of the downtrend. Tight stop-losses and breakout confirmation are advised for any trades initiated from this setup.
Description and Analysis:
1. Previous Uptrend (Left Section):
The chart begins with a strong bullish trend forming a rising channel.
Candles within the channel show consistent higher highs and higher lows, reflecting strong buying momentum up to the peak near $112,000.
2. Range-Bound Movement (Middle Section):
After reaching the top of the channel, Bitcoin enters a consolidation phase.
The price fluctuates horizontally within a well-defined range between approximately $110,800 and $112,000.
Candlestick bodies become shorter with frequent wicks on both sides, indicating indecision and balance between buyers and sellers.
3. Bearish Breakdown:
A sharp bearish breakout follows, with a long red candle breaking down below the range support.
This marks a shift in sentiment as sellers gain control, driving the price down to around $107,800.
4. Symmetrical Triangle Formation (Right Section):
After the breakdown, price action begins to consolidate again in a symmetrical triangle, showing lower highs and higher lows.
This pattern typically precedes a breakout but doesn't indicate direction.
5. Current Scenario and Potential Breakouts:
Price is nearing the triangle's apex around $108,753.50, suggesting an imminent breakout.
Two scenarios are illustrated:
Bullish breakout: A move above the upper triangle boundary could drive price back toward the previous range resistance around $112,000.
Bearish breakout: A drop below the lower triangle support could lead to further decline toward the $106,000–105,000 area.
Candle Behavior:
High-volume red candles initiated the drop from the range.
Recent candles within the triangle are mixed and relatively small, hinting at consolidation and a battle for control.
Volume contraction supports the idea of a potential breakout setup.
Conclusion:
BTC/USD is currently at a critical juncture. Traders should watch for a decisive breakout from the symmetrical triangle, as it could determine the short-term direction—either a recovery toward previous highs or continuation of the downtrend. Tight stop-losses and breakout confirmation are advised for any trades initiated from this setup.
Trade closed: target reached
Down side target reached t.me/htGGOLD_SOUK_Trd
🟢All Pairs Signals Provided
🟡XAUUSD AND CRYPTO
✅Just Register now and Enjoy
✅No swap & No commission
one.exnesstrack.org/a/siuhoykv4s
🟢All Pairs Signals Provided
🟡XAUUSD AND CRYPTO
✅Just Register now and Enjoy
✅No swap & No commission
one.exnesstrack.org/a/siuhoykv4s
Disclaimer
The information and publications are not meant to be, and do not constitute, financial, investment, trading, or other types of advice or recommendations supplied or endorsed by TradingView. Read more in the Terms of Use.
t.me/htGGOLD_SOUK_Trd
🟢All Pairs Signals Provided
🟡XAUUSD AND CRYPTO
✅Just Register now and Enjoy
✅No swap & No commission
one.exnesstrack.org/a/siuhoykv4s
🟢All Pairs Signals Provided
🟡XAUUSD AND CRYPTO
✅Just Register now and Enjoy
✅No swap & No commission
one.exnesstrack.org/a/siuhoykv4s
Disclaimer
The information and publications are not meant to be, and do not constitute, financial, investment, trading, or other types of advice or recommendations supplied or endorsed by TradingView. Read more in the Terms of Use.