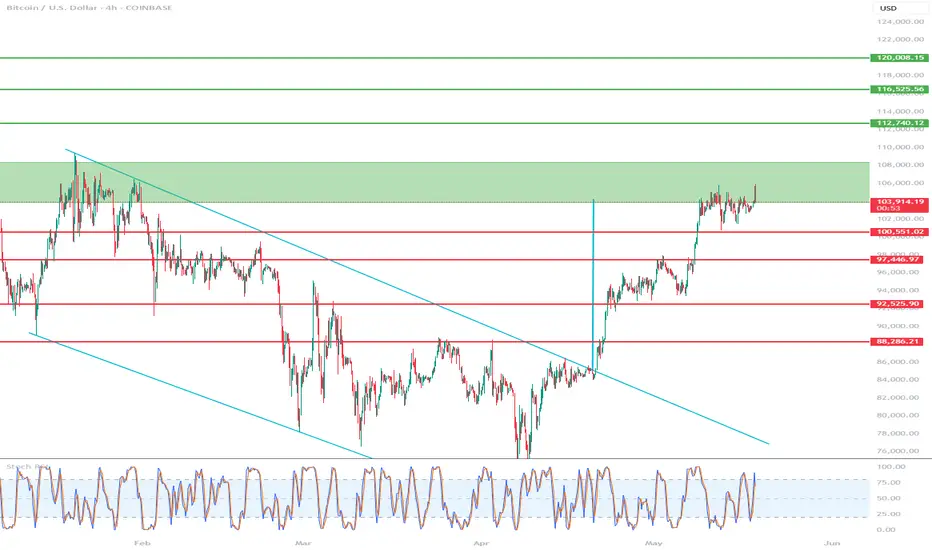
Hello everyone, let's look at the 4H BTC to USD chart, in this situation we can see how the price has come out of the downtrend channel on top, and the upward movement after leaving the channel is close to the height of the downtrend channel.
Let's start by defining the targets for the near future that the price has to face:
However, at the beginning we can see how the price is struggling with a strong resistance zone from $103882 to $108349. Next, we have potential targets:
T1 = 112,740 USD
T2 = 116,525 USD
Т3 = 120,000 USD
Now let's move on to stop-loss in case the market continues to fall:
SL1 = 100,551 USD
SL2 = 97,446 USD
SL3 = 92,525 USD
SL4 = 88,286 USD
The RSI indicator shows that in the 4H interval, the movement is at the upper limit of the range, which clearly affects the sideways movement on the chart.
Disclaimer
The information and publications are not meant to be, and do not constitute, financial, investment, trading, or other types of advice or recommendations supplied or endorsed by TradingView. Read more in the Terms of Use.
Disclaimer
The information and publications are not meant to be, and do not constitute, financial, investment, trading, or other types of advice or recommendations supplied or endorsed by TradingView. Read more in the Terms of Use.