BTC/USD Technical Analysis — Educational Breakdown (July 13, 2025)
🔍 Market Context
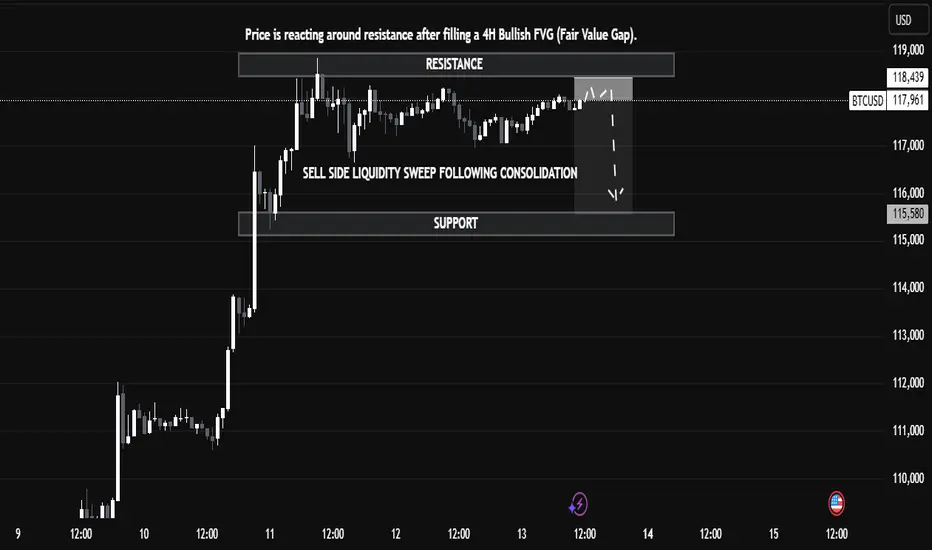
Bitcoin (BTC/USD) is currently trading around $117,913, exhibiting a clear reaction from a well-defined resistance zone between $118,439 and $119,000. This resistance aligns with a previously unfilled 4H Bullish Fair Value Gap (FVG) — a price inefficiency left behind during a strong bullish move — which has now been filled, triggering a pause and reaction in bullish momentum.
🧠 Key Concepts Explained
📘 1. Fair Value Gap (FVG)
In Institutional Price Delivery models (often used in Smart Money Concepts), a Fair Value Gap represents an imbalance in price action — usually between the wicks of candles where price moved too quickly, leaving inefficient trading zones. Price often retraces to these areas before resuming its direction. Here, BTC has filled the 4H Bullish FVG, which acts as a magnet for price and a potential reversal point once filled.
📘 2. Liquidity Sweep
The chart highlights a Sell-Side Liquidity Sweep — this occurs when price dips below a key short-term low or consolidation range to trigger stop-losses and collect liquidity before making its next move. This move is typically engineered by larger market participants to capture orders before deciding on true directional intent.
📘 3. Resistance and Support
Resistance ($118,439 – $119,000): This area is acting as a supply zone where sellers are stepping in after price filled the FVG.
Support ($115,580): This level has previously provided demand and also holds liquidity (stop-losses from long positions), making it a probable target if bearish pressure follows through.
📈 Potential Trade Insight (Educational)
⚠️ This is not financial advice but an educational scenario based on the current technical setup.
Bearish Setup: If price rejects from resistance and forms a lower high, a short entry targeting the support zone at $115,580 could be considered, using a stop above $119,000.
Bullish Invalidator: A break and hold above $119,000 would suggest bullish continuation, potentially targeting higher time frame imbalances or resistance.
📚 Summary & Takeaway for Learners
This chart presents an excellent case study in understanding how institutional concepts like FVGs, liquidity sweeps, and key supply/demand zones interact in real price action. Traders can learn the following from this setup:
Price doesn’t move randomly — it often targets liquidity and imbalances.
Patience is key — waiting for confirmation at known reaction zones can improve trade accuracy.
Market context matters — a filled FVG at resistance combined with a liquidity sweep gives confluence to a bearish outlook.
🔍 Market Context
Bitcoin (BTC/USD) is currently trading around $117,913, exhibiting a clear reaction from a well-defined resistance zone between $118,439 and $119,000. This resistance aligns with a previously unfilled 4H Bullish Fair Value Gap (FVG) — a price inefficiency left behind during a strong bullish move — which has now been filled, triggering a pause and reaction in bullish momentum.
🧠 Key Concepts Explained
📘 1. Fair Value Gap (FVG)
In Institutional Price Delivery models (often used in Smart Money Concepts), a Fair Value Gap represents an imbalance in price action — usually between the wicks of candles where price moved too quickly, leaving inefficient trading zones. Price often retraces to these areas before resuming its direction. Here, BTC has filled the 4H Bullish FVG, which acts as a magnet for price and a potential reversal point once filled.
📘 2. Liquidity Sweep
The chart highlights a Sell-Side Liquidity Sweep — this occurs when price dips below a key short-term low or consolidation range to trigger stop-losses and collect liquidity before making its next move. This move is typically engineered by larger market participants to capture orders before deciding on true directional intent.
📘 3. Resistance and Support
Resistance ($118,439 – $119,000): This area is acting as a supply zone where sellers are stepping in after price filled the FVG.
Support ($115,580): This level has previously provided demand and also holds liquidity (stop-losses from long positions), making it a probable target if bearish pressure follows through.
📈 Potential Trade Insight (Educational)
⚠️ This is not financial advice but an educational scenario based on the current technical setup.
Bearish Setup: If price rejects from resistance and forms a lower high, a short entry targeting the support zone at $115,580 could be considered, using a stop above $119,000.
Bullish Invalidator: A break and hold above $119,000 would suggest bullish continuation, potentially targeting higher time frame imbalances or resistance.
📚 Summary & Takeaway for Learners
This chart presents an excellent case study in understanding how institutional concepts like FVGs, liquidity sweeps, and key supply/demand zones interact in real price action. Traders can learn the following from this setup:
Price doesn’t move randomly — it often targets liquidity and imbalances.
Patience is key — waiting for confirmation at known reaction zones can improve trade accuracy.
Market context matters — a filled FVG at resistance combined with a liquidity sweep gives confluence to a bearish outlook.
Trade active
BTC Trade Activated – 121500Entered based on retest of key structure zone.
Watch price action for learning real-time trade management.
Trade closed: target reached
✅ Partial Target Reached!Price respected our key level and moved with strong momentum. The setup remains active — eyeing the next target for full completion!
📈 Trade Completed: All Take-Profits Secured 🎯🚀
BTC/USD – All target levels hit with precision!
Impeccable trade execution backed by strong bullish flow and a clean breakout. Another solid win secured and recorded! ✅
Market Analyst | XAU/USD Focused
Educational Content & Technical Breakdowns
Premium VIP Signals & Market Insights
Forex Mentorship & Affiliate Opportunities
Join our Telegram t.me/Mentor_Michael033
Educational Content & Technical Breakdowns
Premium VIP Signals & Market Insights
Forex Mentorship & Affiliate Opportunities
Join our Telegram t.me/Mentor_Michael033
Disclaimer
The information and publications are not meant to be, and do not constitute, financial, investment, trading, or other types of advice or recommendations supplied or endorsed by TradingView. Read more in the Terms of Use.