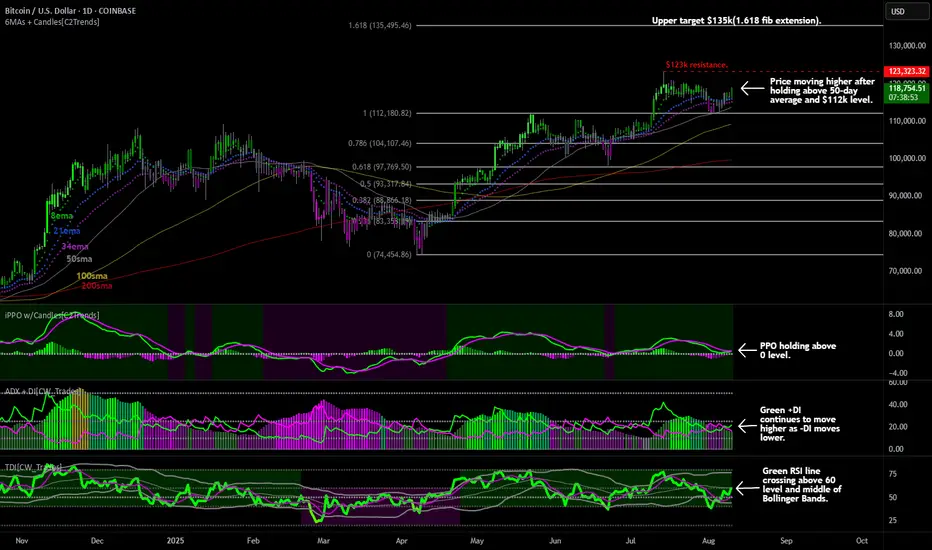
Bitcoin is moving higher this weekend and is up $4k from the post last week highlighting the bullish outlook after price held above the previous resistance level of $112k and the 50-day average. $112k looks to be the new floor now and the chart is holding true to "previous resistance becomes support". Target to watch for here is still the new all-time high resistance level of $123k. Should traders push price above that level, the 1.618 fibonacci extension at $135k is the next price level that I'm watching for.
Lower chart indicators are turning more bullish as price marches up to that $123k level:
The PPO indicator is still showing the green PPO line and purple signal line holding above the 0 level which indicates that price still has long-term bullish momentum. For short-term momentum to turn more bullish we need to see the green line cross above the purple line.
The ADX indicator shows the green +DI line still moving higher and above a declining -DI line which indicates short-term bullish strength behind this move higher. Need to see the background histogram continue to move higher and cross above the 25 level as a sign that price strength is flipping bullish in the intermediate to long-term.
The lower TDI indicator shows the green RSI line rising and crossing above the 60 level which indicates long-term bullish price trend. The green RSI line is also crossing above the middle Bollinger Band and into the upper half of the bands which is bullish for price as well.
Overall, outlook remains bullish here for Bitcoin as long-term fundamentals continue to strengthen with tail winds such as more buying by treasury companies-and new companies announcing treasuries-and the Executive Order signed by Trump last week allowing 401k's to offer Bitcoin to customers. That may take a year or two before we actually see 401k's announce that crypto assets are available to clients, but it definitely increases the bullish case for buying and holding here as new money is destine to flood into Bitcoin in the coming years.
Keep stackin' those Sats.
Disclaimer
The information and publications are not meant to be, and do not constitute, financial, investment, trading, or other types of advice or recommendations supplied or endorsed by TradingView. Read more in the Terms of Use.
Disclaimer
The information and publications are not meant to be, and do not constitute, financial, investment, trading, or other types of advice or recommendations supplied or endorsed by TradingView. Read more in the Terms of Use.
