Bitcoin, the pioneering cryptocurrency, is once again at the forefront of financial discussions, exhibiting a remarkable display of resilience and strength that points towards an imminent surge to uncharted price territories. The current market narrative is dominated by several compelling indicators: a significant increase in long-term holders, a climbing realized capitalization, the inherent stability provided by its difficulty adjustment mechanism, and a pervasive return to "HODL mode" among investors. These factors, combined with recent price action and expert analyses, suggest that Bitcoin is not just preparing for new all-time highs but is solidifying its position as a mature and indispensable asset in the global financial landscape.
Long-Term Holders Strengthen Their Grip: A Foundation for Future Growth
One of the most telling indicators of Bitcoin's underlying strength and investor conviction is the behavior of its long-term holders (LTHs). These are addresses that have held their Bitcoin for an extended period, typically over 155 days, signaling a strong belief in its future value rather than short-term speculation. Recent data reveals a significant uptick in the number of these steadfast investors, indicating a profound shift in market sentiment. This trend is critical because it removes a substantial portion of the circulating supply from immediate selling pressure, creating a scarcity that naturally supports price appreciation.
The "HODL mode" phenomenon, a term coined from a misspelling of "hold" in a 2013 forum post, perfectly encapsulates this behavior. It describes the strategy of buying and holding cryptocurrencies regardless of price fluctuations, driven by a long-term bullish outlook. The return of this "HODL mode" is not merely anecdotal; it is quantifiable through on-chain metrics. When long-term holders accumulate and resist selling, it signifies a collective conviction that current prices do not reflect Bitcoin's true intrinsic value or future potential. This behavior creates a strong psychological floor for the price, as fewer coins are available for sale on exchanges, making it harder for large sell-offs to occur.
Complementing this, Bitcoin's Realized Cap has been climbing to uncharted territory. The Realized Cap is a variation of market capitalization that values each Bitcoin at the price it was last moved on-chain, rather than its current market price. It essentially represents the aggregate cost basis of all coins in circulation. When the Realized Cap climbs, especially to new all-time highs, it indicates that a significant amount of Bitcoin has been acquired at higher prices and is being held, suggesting that the overall market is holding onto its coins with stronger conviction. This metric serves as a robust measure of the network's fundamental value and the collective cost basis of its investors. Its ascent to new peaks underscores the increasing capital flowing into Bitcoin and the growing confidence among those holding it. This phenomenon is often observed during bull markets, as new capital enters the ecosystem and existing holders refuse to sell, signaling a healthy and maturing market.
The strengthening grip of long-term holders and the rising Realized Cap collectively paint a picture of a market that is fundamentally sound and poised for sustained growth. It suggests that Bitcoin is moving from a speculative asset to a more mature store of value, attracting investors who are less concerned with short-term volatility and more focused on its long-term potential as a digital asset.
Bitcoin's Difficulty Adjustment: The Engine of Predictable Monetary Policy
One of Bitcoin's most ingenious and often underestimated features is its difficulty adjustment mechanism. This self-regulating system ensures that new blocks are found, and thus new Bitcoin are mined, at a remarkably consistent rate of approximately every 10 minutes, regardless of the total computational power (hash rate) dedicated to the network. Every 2,016 blocks, or roughly every two weeks, the network automatically adjusts the difficulty of the mining puzzle. If more miners join the network, increasing the hash rate, the difficulty increases, making it harder to find the next block. Conversely, if miners leave, the difficulty decreases.
This mechanism is the bedrock of Bitcoin's predictable monetary policy. Unlike traditional fiat currencies, whose supply can be arbitrarily increased by central banks, Bitcoin's supply schedule is immutable and transparent. The difficulty adjustment ensures that the issuance of new Bitcoin remains consistent until the total supply of 21 million coins is reached. This predictability is a cornerstone of Bitcoin's value proposition as a sound money alternative. It eliminates the uncertainty and potential for inflation that plagues fiat currencies, making Bitcoin a reliable store of value over the long term.
The consistent block time and predictable supply schedule, enforced by the difficulty adjustment, contribute significantly to Bitcoin's appeal as a deflationary asset. Investors are drawn to assets with a finite and transparent supply, especially in an era of unprecedented global monetary expansion. This mechanism not only secures the network from external attacks by making it prohibitively expensive to manipulate but also instills confidence in its long-term scarcity and value. It is this algorithmic certainty that underpins Bitcoin's potential to become a global reserve asset, providing a stark contrast to the discretionary policies of central banks.
Why are Bitcoin and Crypto Prices Going Up Today?
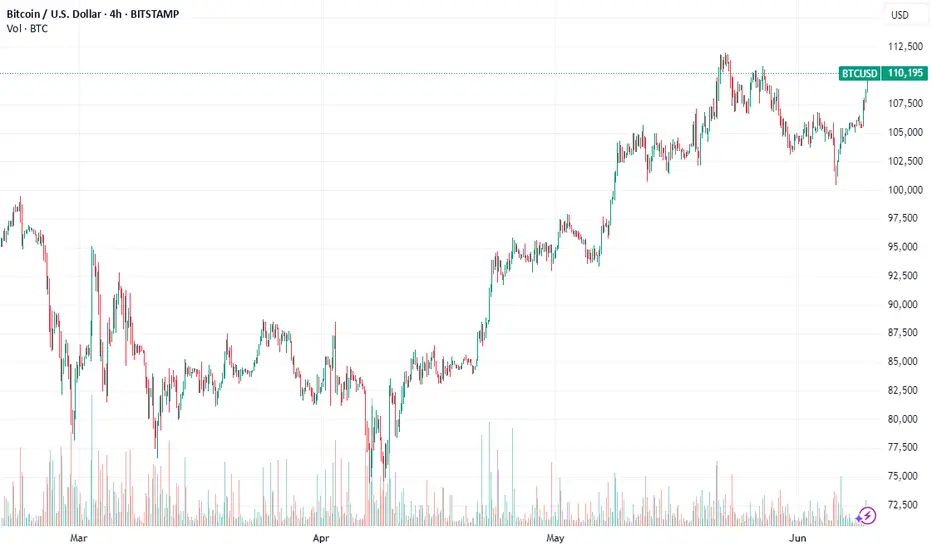
The recent surge in Bitcoin and broader cryptocurrency prices can be attributed to a confluence of factors, many of which are interconnected with the underlying strength discussed above. Bitcoin's impressive climb past $107,000 and its break above $108,000 at the start of the week are not isolated events but rather manifestations of building bullish sentiment.
One primary driver is the return of institutional interest and capital inflows. As Bitcoin matures and gains regulatory clarity in various jurisdictions, traditional financial institutions are increasingly comfortable allocating capital to the asset class. This institutional adoption provides significant buying pressure and lends legitimacy to the market. The establishment of Bitcoin ETFs in various regions, for instance, has opened new avenues for institutional investors to gain exposure without directly holding the underlying asset.
Secondly, the macroeconomic environment continues to play a pivotal role. Persistent inflation concerns, coupled with the potential for further quantitative easing by central banks, drive investors towards scarce assets like Bitcoin as a hedge against currency debasement. The narrative of Bitcoin as "digital gold" gains traction during periods of economic uncertainty, attracting both retail and institutional capital seeking to preserve purchasing power.
Thirdly, technical indicators are flashing strong buy signals. Bitcoin's weekly chart, for instance, is flexing significant strength. A sustained break above key resistance levels, such as the $108,000 mark, often triggers further buying as traders and algorithms recognize the bullish momentum. The return of "HODL mode," as evidenced by the behavior of long-term holders, further reduces selling pressure, allowing prices to climb with less resistance. This combination of fundamental strength and technical breakouts creates a powerful upward spiral.
Finally, anticipation of future events also fuels price rallies. The upcoming June 11 CPI report, for example, is being closely watched by analysts. Inflation data can significantly impact market sentiment, and a favorable report (e.g., lower-than-expected inflation) could signal a more dovish stance from central banks, potentially leading to increased liquidity and risk-on appetite, which benefits Bitcoin. An analyst has even suggested that the Bitcoin price could "explode" after the CPI report, indicating the market's sensitivity to such macroeconomic releases.
Bitcoin Chart Pattern, Return of ‘HODL Mode’ Point to Imminent All-Time BTC Price High
The technical analysis of Bitcoin's price charts, combined with on-chain data indicating a return to "HODL mode," strongly suggests that an imminent all-time high (ATH) is on the horizon. Chart patterns are crucial tools for traders and investors to identify potential future price movements based on historical data. When Bitcoin breaks above significant resistance levels, especially after a period of consolidation, it often signals the start of a new upward trend. The recent break above $108,000 is a prime example of such a breakout, indicating that the market has absorbed previous selling pressure and is now ready for higher valuations.
The "HODL mode" phenomenon, as discussed earlier, is a powerful fundamental indicator that reinforces technical signals. When a large proportion of the circulating supply is being held by long-term investors who are unwilling to sell, it creates a supply shock. This reduced selling pressure means that even moderate buying interest can lead to significant price increases. This is particularly true when new capital enters the market, as it encounters a much thinner order book on the sell side. The confluence of a bullish chart pattern and the return of "HODL mode" creates a self-reinforcing cycle: technical breakouts encourage more HODLing, which in turn reduces supply and facilitates further breakouts.
Analysts are increasingly confident that these combined factors point to an imminent all-time high for BTC. The previous all-time high serves as a psychological and technical barrier, but once breached, it often transforms into a new support level, paving the way for further price discovery. The current market structure, characterized by strong accumulation by long-term holders and a clear upward trajectory on the charts, suggests that the path of least resistance for Bitcoin is upwards.
Bitcoin Weekly Chart Flexes Strength—Is The Moonshot Just Getting Started?
Looking at Bitcoin's weekly chart provides a broader perspective on its long-term trend and current momentum. The weekly chart smooths out daily volatility, revealing more significant patterns and trends. Currently, Bitcoin's weekly chart is indeed flexing considerable strength, characterized by consistent higher lows and higher highs, strong closing prices, and increasing trading volume during upward movements. This sustained bullish momentum on a longer timeframe suggests that the current rally is not a fleeting pump but potentially the beginning of a more substantial "moonshot."
The term "moonshot" in crypto parlance refers to a rapid and significant price increase, often to unprecedented levels. While such parabolic moves can be speculative, the current strength on Bitcoin's weekly chart appears to be fundamentally driven. The accumulation by long-term holders, the predictable supply schedule enforced by the difficulty adjustment, and the increasing institutional adoption all contribute to a more sustainable upward trajectory. This is not just about short-term trading gains; it's about a fundamental revaluation of Bitcoin's role in the global financial system.
The question of whether the "moonshot" is just getting started implies that the current price levels are merely a stepping stone to much higher valuations. This perspective is supported by the fact that Bitcoin is still in its relatively early stages of global adoption compared to traditional asset classes. As more individuals, corporations, and even nation-states begin to integrate Bitcoin into their financial strategies, the demand will continue to outstrip the limited supply, fueling further price appreciation. The weekly chart's strength provides a visual confirmation of this underlying bullish narrative, suggesting that the journey to new price frontiers is indeed well underway.
Bitcoin Price Could Explode After June 11 CPI Report, Says Analyst
The highly anticipated June 11 CPI (Consumer Price Index) report is poised to be a significant catalyst for Bitcoin's price action. The CPI is a key economic indicator that measures the average change over time in the prices paid by urban consumers for a market basket of consumer goods and services. It is a primary gauge of inflation, and its release often triggers significant market reactions across all asset classes, including cryptocurrencies.
An analyst's prediction that Bitcoin's price could "explode" after the CPI report highlights the market's sensitivity to inflation data. If the CPI report comes in lower than expected, it could signal that inflationary pressures are easing, potentially leading central banks to adopt a more dovish monetary policy (e.g., interest rate cuts). Lower interest rates reduce the opportunity cost of holding non-yielding assets like Bitcoin, making them more attractive to investors. Conversely, if inflation remains stubbornly high, it could reinforce Bitcoin's narrative as an inflation hedge, also potentially driving its price up as investors seek refuge from fiat currency debasement.
The market's reaction to such reports is often driven by expectations. If the report aligns with or exceeds dovish expectations, it could lead to a surge in liquidity and risk appetite, benefiting Bitcoin. Conversely, an unexpectedly hawkish report could lead to short-term volatility. However, the overarching sentiment among many analysts is that even in a hawkish scenario, Bitcoin's role as a hedge will continue to attract capital. The June 11 CPI report is therefore a critical event that could provide the immediate impetus for Bitcoin's next major price movement, potentially validating the "moonshot" thesis.
Bitcoin Price Will See ‘Short-Term Correction’ Before $140K: Analysts
While the overall sentiment for Bitcoin is overwhelmingly bullish, some analysts predict a "short-term correction" before the price initiates a rally to all-time highs above $140,000. This perspective is not necessarily bearish; rather, it reflects a healthy market dynamic. Corrections are a natural part of any asset's price discovery process, allowing the market to consolidate gains, shake out overleveraged positions, and attract new buyers at slightly lower price points.
A short-term correction typically involves a temporary pullback in price after a significant upward move. This can be triggered by profit-taking from early investors, macroeconomic news, or technical resistance levels. Analysts who foresee such a correction often view it as a necessary reset that builds a stronger foundation for the next leg of the rally. For instance, a drop could see Bitcoin retest key support levels that were previously resistance, confirming their strength before moving higher.
The prediction of a correction before reaching $140,000 suggests that while the long-term outlook is incredibly strong, the path to new all-time highs may not be a straight line. Such a correction could present an excellent buying opportunity for those who missed the initial surge or wish to increase their holdings. It also aligns with the idea of a healthy market that allows for organic growth rather than unsustainable parabolic pumps. The $140,000 target itself is a significant psychological and technical level, and reaching it would mark a substantial milestone for Bitcoin, further solidifying its position as a premier digital asset.
The Return of Altcoin Season: Why Bitcoin Dominance Must Fall To 62%
As Bitcoin continues its ascent, the conversation often shifts to the broader cryptocurrency market, specifically the potential for an "Altcoin Season." Altcoin Season refers to a period when altcoins (cryptocurrencies other than Bitcoin) experience significant price appreciation, often outperforming Bitcoin. For an Altcoin Season to truly kick off, analysts often point to a crucial prerequisite: a decrease in Bitcoin's dominance.
Bitcoin dominance (BTCD) measures Bitcoin's market capitalization as a percentage of the total cryptocurrency market capitalization. Currently, Bitcoin's dominance is relatively high, reflecting its recent strength and the capital flowing into it. However, for altcoins to flourish, capital needs to flow from Bitcoin into other cryptocurrencies. This typically happens when Bitcoin has made significant gains, and investors begin to seek higher returns in riskier, smaller-cap altcoins.
The specific threshold of Bitcoin dominance falling to 62% is often cited as a key indicator for the start of Altcoin Season. When Bitcoin's dominance drops to this level or lower, it suggests that a substantial amount of capital is rotating out of Bitcoin and into altcoins, signaling a broader market rally. This rotation is a healthy sign of market maturation, as it indicates that investors are diversifying their portfolios and recognizing the value proposition of other blockchain projects.
The return of Altcoin Season would signify a broader bullish trend across the entire cryptocurrency ecosystem. It would mean that the value proposition of decentralized finance (DeFi), non-fungible tokens (NFTs), and various Layer 1 and Layer 2 solutions built on other blockchains is gaining traction. While Bitcoin remains the undisputed king, a thriving altcoin market indicates a robust and diversified digital economy. The anticipation of this shift further underscores the dynamic and evolving nature of the cryptocurrency market, where Bitcoin's strength often paves the way for the growth of the entire ecosystem.
In conclusion, Bitcoin stands on the precipice of a new era of growth, driven by a powerful synergy of fundamental strength, technical indicators, and evolving market dynamics. The unwavering conviction of long-term holders, evidenced by a climbing Realized Cap and a pervasive "HODL mode," forms a robust foundation. The predictable monetary policy enforced by the difficulty adjustment mechanism instills unwavering confidence in its scarcity. Recent price surges, fueled by institutional interest and macroeconomic tailwinds, underscore its immediate bullish momentum. While a short-term correction may be on the cards, it is viewed as a healthy precursor to an explosive rally towards and beyond the $140,000 mark. Furthermore, Bitcoin's continued strength is expected to eventually pave the way for an "Altcoin Season," signaling the maturation and diversification of the broader crypto market. For investors and
enthusiasts alike, ignoring Bitcoin's current trajectory would be to miss a pivotal moment in the ongoing digital revolution, as it solidifies its grip on the financial future.
Long-Term Holders Strengthen Their Grip: A Foundation for Future Growth
One of the most telling indicators of Bitcoin's underlying strength and investor conviction is the behavior of its long-term holders (LTHs). These are addresses that have held their Bitcoin for an extended period, typically over 155 days, signaling a strong belief in its future value rather than short-term speculation. Recent data reveals a significant uptick in the number of these steadfast investors, indicating a profound shift in market sentiment. This trend is critical because it removes a substantial portion of the circulating supply from immediate selling pressure, creating a scarcity that naturally supports price appreciation.
The "HODL mode" phenomenon, a term coined from a misspelling of "hold" in a 2013 forum post, perfectly encapsulates this behavior. It describes the strategy of buying and holding cryptocurrencies regardless of price fluctuations, driven by a long-term bullish outlook. The return of this "HODL mode" is not merely anecdotal; it is quantifiable through on-chain metrics. When long-term holders accumulate and resist selling, it signifies a collective conviction that current prices do not reflect Bitcoin's true intrinsic value or future potential. This behavior creates a strong psychological floor for the price, as fewer coins are available for sale on exchanges, making it harder for large sell-offs to occur.
Complementing this, Bitcoin's Realized Cap has been climbing to uncharted territory. The Realized Cap is a variation of market capitalization that values each Bitcoin at the price it was last moved on-chain, rather than its current market price. It essentially represents the aggregate cost basis of all coins in circulation. When the Realized Cap climbs, especially to new all-time highs, it indicates that a significant amount of Bitcoin has been acquired at higher prices and is being held, suggesting that the overall market is holding onto its coins with stronger conviction. This metric serves as a robust measure of the network's fundamental value and the collective cost basis of its investors. Its ascent to new peaks underscores the increasing capital flowing into Bitcoin and the growing confidence among those holding it. This phenomenon is often observed during bull markets, as new capital enters the ecosystem and existing holders refuse to sell, signaling a healthy and maturing market.
The strengthening grip of long-term holders and the rising Realized Cap collectively paint a picture of a market that is fundamentally sound and poised for sustained growth. It suggests that Bitcoin is moving from a speculative asset to a more mature store of value, attracting investors who are less concerned with short-term volatility and more focused on its long-term potential as a digital asset.
Bitcoin's Difficulty Adjustment: The Engine of Predictable Monetary Policy
One of Bitcoin's most ingenious and often underestimated features is its difficulty adjustment mechanism. This self-regulating system ensures that new blocks are found, and thus new Bitcoin are mined, at a remarkably consistent rate of approximately every 10 minutes, regardless of the total computational power (hash rate) dedicated to the network. Every 2,016 blocks, or roughly every two weeks, the network automatically adjusts the difficulty of the mining puzzle. If more miners join the network, increasing the hash rate, the difficulty increases, making it harder to find the next block. Conversely, if miners leave, the difficulty decreases.
This mechanism is the bedrock of Bitcoin's predictable monetary policy. Unlike traditional fiat currencies, whose supply can be arbitrarily increased by central banks, Bitcoin's supply schedule is immutable and transparent. The difficulty adjustment ensures that the issuance of new Bitcoin remains consistent until the total supply of 21 million coins is reached. This predictability is a cornerstone of Bitcoin's value proposition as a sound money alternative. It eliminates the uncertainty and potential for inflation that plagues fiat currencies, making Bitcoin a reliable store of value over the long term.
The consistent block time and predictable supply schedule, enforced by the difficulty adjustment, contribute significantly to Bitcoin's appeal as a deflationary asset. Investors are drawn to assets with a finite and transparent supply, especially in an era of unprecedented global monetary expansion. This mechanism not only secures the network from external attacks by making it prohibitively expensive to manipulate but also instills confidence in its long-term scarcity and value. It is this algorithmic certainty that underpins Bitcoin's potential to become a global reserve asset, providing a stark contrast to the discretionary policies of central banks.
Why are Bitcoin and Crypto Prices Going Up Today?
The recent surge in Bitcoin and broader cryptocurrency prices can be attributed to a confluence of factors, many of which are interconnected with the underlying strength discussed above. Bitcoin's impressive climb past $107,000 and its break above $108,000 at the start of the week are not isolated events but rather manifestations of building bullish sentiment.
One primary driver is the return of institutional interest and capital inflows. As Bitcoin matures and gains regulatory clarity in various jurisdictions, traditional financial institutions are increasingly comfortable allocating capital to the asset class. This institutional adoption provides significant buying pressure and lends legitimacy to the market. The establishment of Bitcoin ETFs in various regions, for instance, has opened new avenues for institutional investors to gain exposure without directly holding the underlying asset.
Secondly, the macroeconomic environment continues to play a pivotal role. Persistent inflation concerns, coupled with the potential for further quantitative easing by central banks, drive investors towards scarce assets like Bitcoin as a hedge against currency debasement. The narrative of Bitcoin as "digital gold" gains traction during periods of economic uncertainty, attracting both retail and institutional capital seeking to preserve purchasing power.
Thirdly, technical indicators are flashing strong buy signals. Bitcoin's weekly chart, for instance, is flexing significant strength. A sustained break above key resistance levels, such as the $108,000 mark, often triggers further buying as traders and algorithms recognize the bullish momentum. The return of "HODL mode," as evidenced by the behavior of long-term holders, further reduces selling pressure, allowing prices to climb with less resistance. This combination of fundamental strength and technical breakouts creates a powerful upward spiral.
Finally, anticipation of future events also fuels price rallies. The upcoming June 11 CPI report, for example, is being closely watched by analysts. Inflation data can significantly impact market sentiment, and a favorable report (e.g., lower-than-expected inflation) could signal a more dovish stance from central banks, potentially leading to increased liquidity and risk-on appetite, which benefits Bitcoin. An analyst has even suggested that the Bitcoin price could "explode" after the CPI report, indicating the market's sensitivity to such macroeconomic releases.
Bitcoin Chart Pattern, Return of ‘HODL Mode’ Point to Imminent All-Time BTC Price High
The technical analysis of Bitcoin's price charts, combined with on-chain data indicating a return to "HODL mode," strongly suggests that an imminent all-time high (ATH) is on the horizon. Chart patterns are crucial tools for traders and investors to identify potential future price movements based on historical data. When Bitcoin breaks above significant resistance levels, especially after a period of consolidation, it often signals the start of a new upward trend. The recent break above $108,000 is a prime example of such a breakout, indicating that the market has absorbed previous selling pressure and is now ready for higher valuations.
The "HODL mode" phenomenon, as discussed earlier, is a powerful fundamental indicator that reinforces technical signals. When a large proportion of the circulating supply is being held by long-term investors who are unwilling to sell, it creates a supply shock. This reduced selling pressure means that even moderate buying interest can lead to significant price increases. This is particularly true when new capital enters the market, as it encounters a much thinner order book on the sell side. The confluence of a bullish chart pattern and the return of "HODL mode" creates a self-reinforcing cycle: technical breakouts encourage more HODLing, which in turn reduces supply and facilitates further breakouts.
Analysts are increasingly confident that these combined factors point to an imminent all-time high for BTC. The previous all-time high serves as a psychological and technical barrier, but once breached, it often transforms into a new support level, paving the way for further price discovery. The current market structure, characterized by strong accumulation by long-term holders and a clear upward trajectory on the charts, suggests that the path of least resistance for Bitcoin is upwards.
Bitcoin Weekly Chart Flexes Strength—Is The Moonshot Just Getting Started?
Looking at Bitcoin's weekly chart provides a broader perspective on its long-term trend and current momentum. The weekly chart smooths out daily volatility, revealing more significant patterns and trends. Currently, Bitcoin's weekly chart is indeed flexing considerable strength, characterized by consistent higher lows and higher highs, strong closing prices, and increasing trading volume during upward movements. This sustained bullish momentum on a longer timeframe suggests that the current rally is not a fleeting pump but potentially the beginning of a more substantial "moonshot."
The term "moonshot" in crypto parlance refers to a rapid and significant price increase, often to unprecedented levels. While such parabolic moves can be speculative, the current strength on Bitcoin's weekly chart appears to be fundamentally driven. The accumulation by long-term holders, the predictable supply schedule enforced by the difficulty adjustment, and the increasing institutional adoption all contribute to a more sustainable upward trajectory. This is not just about short-term trading gains; it's about a fundamental revaluation of Bitcoin's role in the global financial system.
The question of whether the "moonshot" is just getting started implies that the current price levels are merely a stepping stone to much higher valuations. This perspective is supported by the fact that Bitcoin is still in its relatively early stages of global adoption compared to traditional asset classes. As more individuals, corporations, and even nation-states begin to integrate Bitcoin into their financial strategies, the demand will continue to outstrip the limited supply, fueling further price appreciation. The weekly chart's strength provides a visual confirmation of this underlying bullish narrative, suggesting that the journey to new price frontiers is indeed well underway.
Bitcoin Price Could Explode After June 11 CPI Report, Says Analyst
The highly anticipated June 11 CPI (Consumer Price Index) report is poised to be a significant catalyst for Bitcoin's price action. The CPI is a key economic indicator that measures the average change over time in the prices paid by urban consumers for a market basket of consumer goods and services. It is a primary gauge of inflation, and its release often triggers significant market reactions across all asset classes, including cryptocurrencies.
An analyst's prediction that Bitcoin's price could "explode" after the CPI report highlights the market's sensitivity to inflation data. If the CPI report comes in lower than expected, it could signal that inflationary pressures are easing, potentially leading central banks to adopt a more dovish monetary policy (e.g., interest rate cuts). Lower interest rates reduce the opportunity cost of holding non-yielding assets like Bitcoin, making them more attractive to investors. Conversely, if inflation remains stubbornly high, it could reinforce Bitcoin's narrative as an inflation hedge, also potentially driving its price up as investors seek refuge from fiat currency debasement.
The market's reaction to such reports is often driven by expectations. If the report aligns with or exceeds dovish expectations, it could lead to a surge in liquidity and risk appetite, benefiting Bitcoin. Conversely, an unexpectedly hawkish report could lead to short-term volatility. However, the overarching sentiment among many analysts is that even in a hawkish scenario, Bitcoin's role as a hedge will continue to attract capital. The June 11 CPI report is therefore a critical event that could provide the immediate impetus for Bitcoin's next major price movement, potentially validating the "moonshot" thesis.
Bitcoin Price Will See ‘Short-Term Correction’ Before $140K: Analysts
While the overall sentiment for Bitcoin is overwhelmingly bullish, some analysts predict a "short-term correction" before the price initiates a rally to all-time highs above $140,000. This perspective is not necessarily bearish; rather, it reflects a healthy market dynamic. Corrections are a natural part of any asset's price discovery process, allowing the market to consolidate gains, shake out overleveraged positions, and attract new buyers at slightly lower price points.
A short-term correction typically involves a temporary pullback in price after a significant upward move. This can be triggered by profit-taking from early investors, macroeconomic news, or technical resistance levels. Analysts who foresee such a correction often view it as a necessary reset that builds a stronger foundation for the next leg of the rally. For instance, a drop could see Bitcoin retest key support levels that were previously resistance, confirming their strength before moving higher.
The prediction of a correction before reaching $140,000 suggests that while the long-term outlook is incredibly strong, the path to new all-time highs may not be a straight line. Such a correction could present an excellent buying opportunity for those who missed the initial surge or wish to increase their holdings. It also aligns with the idea of a healthy market that allows for organic growth rather than unsustainable parabolic pumps. The $140,000 target itself is a significant psychological and technical level, and reaching it would mark a substantial milestone for Bitcoin, further solidifying its position as a premier digital asset.
The Return of Altcoin Season: Why Bitcoin Dominance Must Fall To 62%
As Bitcoin continues its ascent, the conversation often shifts to the broader cryptocurrency market, specifically the potential for an "Altcoin Season." Altcoin Season refers to a period when altcoins (cryptocurrencies other than Bitcoin) experience significant price appreciation, often outperforming Bitcoin. For an Altcoin Season to truly kick off, analysts often point to a crucial prerequisite: a decrease in Bitcoin's dominance.
Bitcoin dominance (BTCD) measures Bitcoin's market capitalization as a percentage of the total cryptocurrency market capitalization. Currently, Bitcoin's dominance is relatively high, reflecting its recent strength and the capital flowing into it. However, for altcoins to flourish, capital needs to flow from Bitcoin into other cryptocurrencies. This typically happens when Bitcoin has made significant gains, and investors begin to seek higher returns in riskier, smaller-cap altcoins.
The specific threshold of Bitcoin dominance falling to 62% is often cited as a key indicator for the start of Altcoin Season. When Bitcoin's dominance drops to this level or lower, it suggests that a substantial amount of capital is rotating out of Bitcoin and into altcoins, signaling a broader market rally. This rotation is a healthy sign of market maturation, as it indicates that investors are diversifying their portfolios and recognizing the value proposition of other blockchain projects.
The return of Altcoin Season would signify a broader bullish trend across the entire cryptocurrency ecosystem. It would mean that the value proposition of decentralized finance (DeFi), non-fungible tokens (NFTs), and various Layer 1 and Layer 2 solutions built on other blockchains is gaining traction. While Bitcoin remains the undisputed king, a thriving altcoin market indicates a robust and diversified digital economy. The anticipation of this shift further underscores the dynamic and evolving nature of the cryptocurrency market, where Bitcoin's strength often paves the way for the growth of the entire ecosystem.
In conclusion, Bitcoin stands on the precipice of a new era of growth, driven by a powerful synergy of fundamental strength, technical indicators, and evolving market dynamics. The unwavering conviction of long-term holders, evidenced by a climbing Realized Cap and a pervasive "HODL mode," forms a robust foundation. The predictable monetary policy enforced by the difficulty adjustment mechanism instills unwavering confidence in its scarcity. Recent price surges, fueled by institutional interest and macroeconomic tailwinds, underscore its immediate bullish momentum. While a short-term correction may be on the cards, it is viewed as a healthy precursor to an explosive rally towards and beyond the $140,000 mark. Furthermore, Bitcoin's continued strength is expected to eventually pave the way for an "Altcoin Season," signaling the maturation and diversification of the broader crypto market. For investors and
enthusiasts alike, ignoring Bitcoin's current trajectory would be to miss a pivotal moment in the ongoing digital revolution, as it solidifies its grip on the financial future.
Get your free C++ High Frequency Trading ebook at
quantlabsnet.com/registration
Or talk me live 1 on 1 at wa.me/16477809447?text=Hi I saw you on TradingView and I got questions
quantlabsnet.com/registration
Or talk me live 1 on 1 at wa.me/16477809447?text=Hi I saw you on TradingView and I got questions
Disclaimer
The information and publications are not meant to be, and do not constitute, financial, investment, trading, or other types of advice or recommendations supplied or endorsed by TradingView. Read more in the Terms of Use.