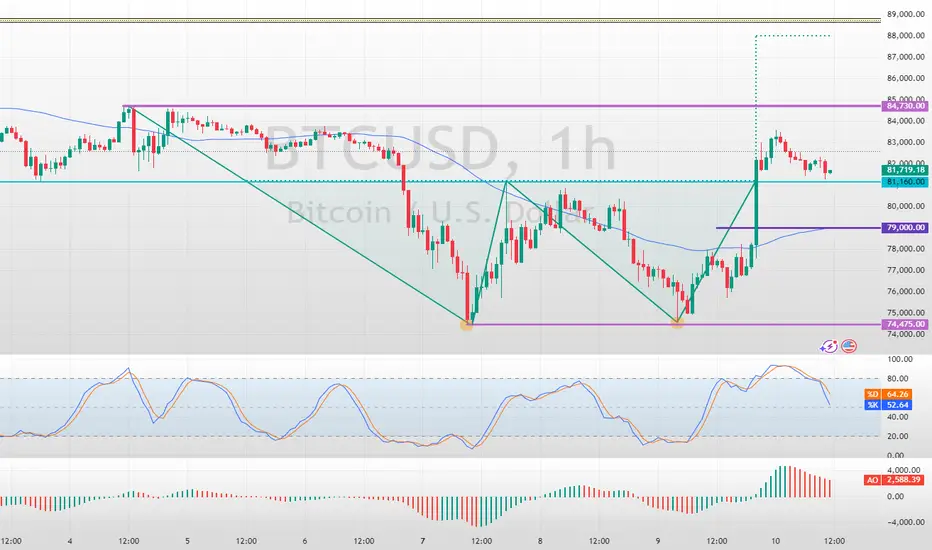
FenzoFx—Bitcoin jumped upward from $74,475 support as expected due to the formation of a double bottom pattern on the 1-hour chart, which is a bullish signal.
As of this writing, the price is stabilizing and testing the $81,160 mark as support. However, the 50-SMA on the 1-hour chart serves as the pivot point between the bull and bear market.
The next bullish target could be $84,730, followed by $88,000 if BTC holds above the discussed moving average.
Trade BTC/USD Swap Free at FenzoFx Decentralized Broker
Knowledge Should Be Free – And So Is Your Path to Trading Success.
Disclaimer
The information and publications are not meant to be, and do not constitute, financial, investment, trading, or other types of advice or recommendations supplied or endorsed by TradingView. Read more in the Terms of Use.
Knowledge Should Be Free – And So Is Your Path to Trading Success.
Disclaimer
The information and publications are not meant to be, and do not constitute, financial, investment, trading, or other types of advice or recommendations supplied or endorsed by TradingView. Read more in the Terms of Use.