2D chart

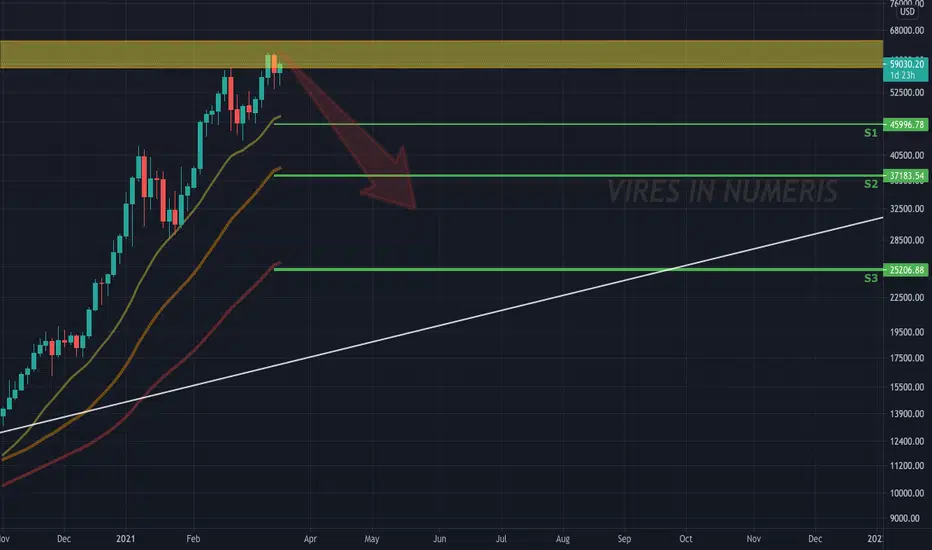
on 12D we have somewhat of a bad candle at the moment

the more we go up and don't extend higher than the previous candle this candle even if we close this 12d candle over 58k its going to be a bearish candle and if it forms as a Doji then it will most likely bring us a hanging man scenario for a down fall
on 12D we have somewhat of a bad candle at the moment
the more we go up and don't extend higher than the previous candle this candle even if we close this 12d candle over 58k its going to be a bearish candle and if it forms as a Doji then it will most likely bring us a hanging man scenario for a down fall
Note
Note
Note
Note
Note
Note
Note
Note
Note
Note
Note
Note
Note
Note
Note
Note
Note
Note
Note
Note
Note
Note
VIRES IN NUMERIS
🦦🎢👍🏻
Trend Breakout architect
—> join my free telegram channel ✅🚀✅🚀✅🚀
t.me/cryptosanction
🦦🎢👍🏻
Trend Breakout architect
—> join my free telegram channel ✅🚀✅🚀✅🚀
t.me/cryptosanction
Related publications
Disclaimer
The information and publications are not meant to be, and do not constitute, financial, investment, trading, or other types of advice or recommendations supplied or endorsed by TradingView. Read more in the Terms of Use.