Chart Pattern:
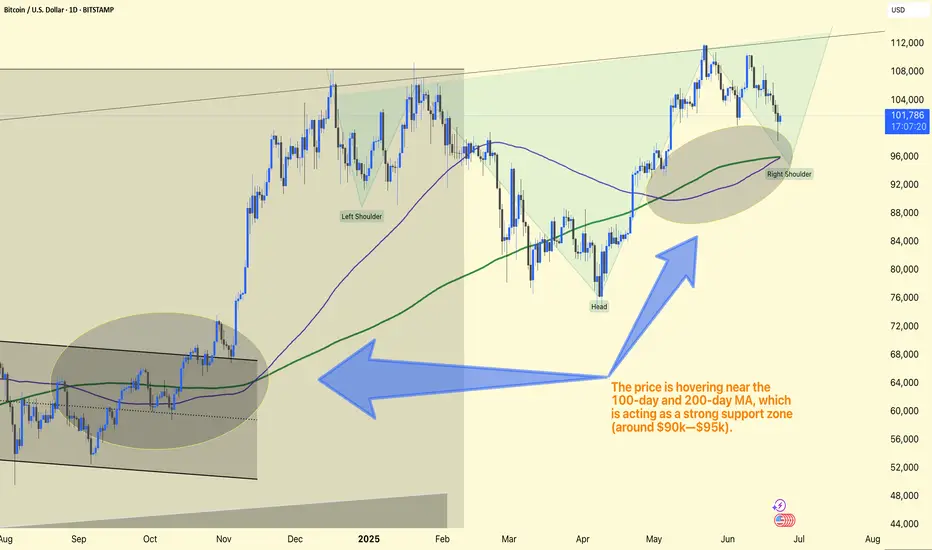
The chart clearly shows an Inverse Head & Shoulders structure:
Left Shoulder
Head
Right Shoulder
This is a strong bullish reversal pattern.
Moving Averages:
Price hovers near the 100-day and 200-day MA, acting as a strong support zone (around $90k–$95k).
This area is critical for sustaining long positions.
Expected Move:
Strong bullish potential towards the $113k–$115k zone, aligned with the upper trendline target.
RSI also suggests room for a bullish recovery from this zone.
Trade Plan:
Ideal Entry: Near $90k–$95k (Right Shoulder area)
Stop Loss: Just below $88k
Target: $113k–$115k
This structure is very favorable for long positions if the price confirms strength within the right shoulder zone.
Related publications
Disclaimer
The information and publications are not meant to be, and do not constitute, financial, investment, trading, or other types of advice or recommendations supplied or endorsed by TradingView. Read more in the Terms of Use.
Related publications
Disclaimer
The information and publications are not meant to be, and do not constitute, financial, investment, trading, or other types of advice or recommendations supplied or endorsed by TradingView. Read more in the Terms of Use.