🔄 Disruption Analysis:
1. Weak Support Confirmation
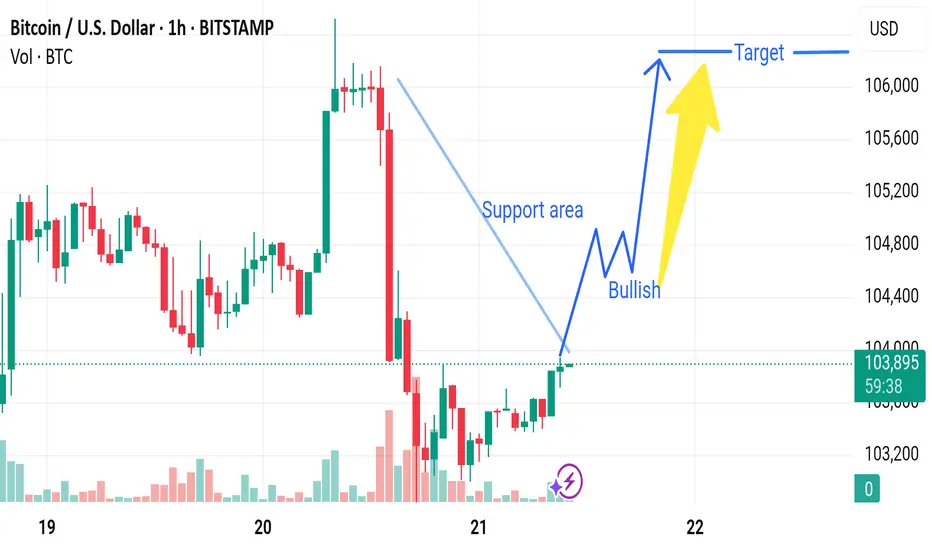
The chart marks a "Support area," but there is no strong confirmation (e.g., a hammer or engulfing bullish candle with high volume).
Support zones are more reliable with multiple prior bounces; here, it seems newly identified and not yet validated.
2. Bearish Volume Signature
During the recent decline (before the support), the red volume bars are significantly larger, indicating strong selling pressure.
The recovery candles near support have low volume, which may signal lack of conviction from bulls.
3. Lower Highs Formation
Prior to the drop, we see a series of lower highs, hinting at weakening bullish momentum.
This could suggest a potential bearish continuation, especially if price fails to break above the last local high (~106,000).
4. Possible Bearish Retest
Instead of a bullish breakout, the current price might just be retesting the broken support-turned-resistance.
This is a common bull trap scenario where prices bounce slightly before resuming downward.
1. Weak Support Confirmation
The chart marks a "Support area," but there is no strong confirmation (e.g., a hammer or engulfing bullish candle with high volume).
Support zones are more reliable with multiple prior bounces; here, it seems newly identified and not yet validated.
2. Bearish Volume Signature
During the recent decline (before the support), the red volume bars are significantly larger, indicating strong selling pressure.
The recovery candles near support have low volume, which may signal lack of conviction from bulls.
3. Lower Highs Formation
Prior to the drop, we see a series of lower highs, hinting at weakening bullish momentum.
This could suggest a potential bearish continuation, especially if price fails to break above the last local high (~106,000).
4. Possible Bearish Retest
Instead of a bullish breakout, the current price might just be retesting the broken support-turned-resistance.
This is a common bull trap scenario where prices bounce slightly before resuming downward.
t.me/gold_free_signals1
𝙁𝙤𝙧𝙚𝙭 𝙩𝙧𝙖𝙙𝙞𝙣𝙜 𝙚𝙭𝙥𝙚𝙧𝙞𝙚𝙣𝙘𝙚 𝙩𝙚𝙖𝙢 ☺️ 𝙢𝙖𝙣𝙖𝙜𝙚 𝙮𝙤𝙪𝙧 𝙖𝙘𝙘𝙤𝙪𝙣𝙩 𝙢𝙖𝙠𝙞𝙣𝙜 𝙢𝙤𝙣𝙚𝙮 🤑💰
t.me/gold_free_signals1
𝙁𝙤𝙧𝙚𝙭 𝙩𝙧𝙖𝙙𝙞𝙣𝙜 𝙚𝙭𝙥𝙚𝙧𝙞𝙚𝙣𝙘𝙚 𝙩𝙚𝙖𝙢 ☺️ 𝙢𝙖𝙣𝙖𝙜𝙚 𝙮𝙤𝙪𝙧 𝙖𝙘𝙘𝙤𝙪𝙣𝙩 𝙢𝙖𝙠𝙞𝙣𝙜 𝙢𝙤𝙣𝙚𝙮 🤑💰
t.me/gold_free_signals1
Disclaimer
The information and publications are not meant to be, and do not constitute, financial, investment, trading, or other types of advice or recommendations supplied or endorsed by TradingView. Read more in the Terms of Use.
t.me/gold_free_signals1
𝙁𝙤𝙧𝙚𝙭 𝙩𝙧𝙖𝙙𝙞𝙣𝙜 𝙚𝙭𝙥𝙚𝙧𝙞𝙚𝙣𝙘𝙚 𝙩𝙚𝙖𝙢 ☺️ 𝙢𝙖𝙣𝙖𝙜𝙚 𝙮𝙤𝙪𝙧 𝙖𝙘𝙘𝙤𝙪𝙣𝙩 𝙢𝙖𝙠𝙞𝙣𝙜 𝙢𝙤𝙣𝙚𝙮 🤑💰
t.me/gold_free_signals1
𝙁𝙤𝙧𝙚𝙭 𝙩𝙧𝙖𝙙𝙞𝙣𝙜 𝙚𝙭𝙥𝙚𝙧𝙞𝙚𝙣𝙘𝙚 𝙩𝙚𝙖𝙢 ☺️ 𝙢𝙖𝙣𝙖𝙜𝙚 𝙮𝙤𝙪𝙧 𝙖𝙘𝙘𝙤𝙪𝙣𝙩 𝙢𝙖𝙠𝙞𝙣𝙜 𝙢𝙤𝙣𝙚𝙮 🤑💰
t.me/gold_free_signals1
Disclaimer
The information and publications are not meant to be, and do not constitute, financial, investment, trading, or other types of advice or recommendations supplied or endorsed by TradingView. Read more in the Terms of Use.