The BTC/USD pair broke below the critical support at the 50-day exponential moving average ($35,093) but found support at $30,688.10 near the 38.2% Fibonacci retracement level.
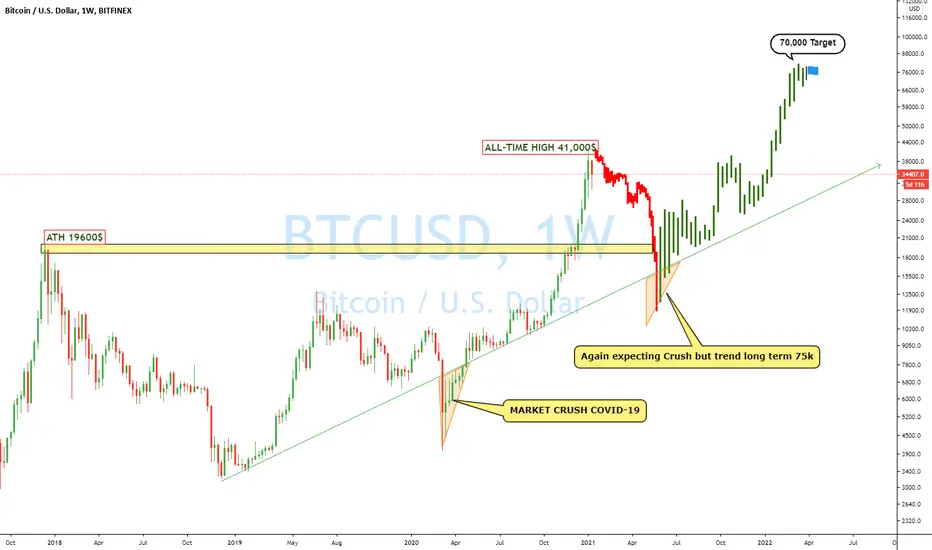
Bitcoin prices have rebounded slightly, following a sell-off from Friday’s high, where BTC/USD broke above $40,000, before facing a wall of resistance formed by the key psychological level of $42,000. The three-day sell-off resulted in a $10,000 depreciation in the digital currency, raising concern that the Bitcoin ‘bubble’ had officially burst. However, the pullback in prices is no comparison to the massive 949% surge from March 2020 low.
BTC still looking strong correction downside on monthly base towards Supports 28k and 25k and small crush or panic crush 17k to 19k$ where we can see new bull start towards long term target 75k$
Remember: 2017 bull and crush 80% and 2020 BULL Little bit different due to institutional investor JUMP in but CRYPTO HIG Volatility market anything could possible like 2017, 50% correction not a big deal for current market price ( 50% correction from the all-time high is 20,000$
🛑SUPPORT/RESISTANCE
✅S1= 28000
✅S2=23000
✴️R1=36000
✴️R2=42000
Please like, share, comments and follow me to get daily base analysis.
Thank you for your support, I appreciate it
Disclaimer
The information and publications are not meant to be, and do not constitute, financial, investment, trading, or other types of advice or recommendations supplied or endorsed by TradingView. Read more in the Terms of Use.
Disclaimer
The information and publications are not meant to be, and do not constitute, financial, investment, trading, or other types of advice or recommendations supplied or endorsed by TradingView. Read more in the Terms of Use.