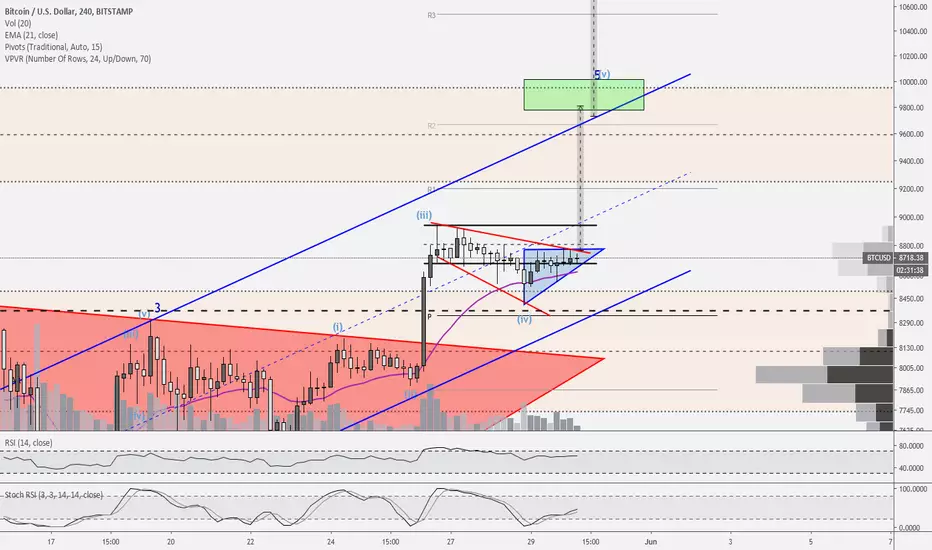
Good morning traders. While the rest of cryptotwitter is freaking out and yelling that the sky is falling, you're paying attention to what's really going on, right? The 4H chart shows that price printed a Spring and a Test recently within the red descending, broadening wedge. This pattern took price just beyond the original channel that I had pointed out, which is fine. The 4H 21 EMA continues to support price as the latter prints higher lows toward the resistance at $8770. The ascending wedge that has resulted at the end of the descending broadening wedge is expected to result in a pop toward the R1 pivot at least. That would take price to the $9200 level. This target aligns with the local TR target. The flagpole leading up to this flag continues to have a target of $9750/$9800 which gets price just above the R2 pivot.
As I have been mentioning, that $9800-$10,000 level is my initial conservative price top expectation, with the latter end of it being the general level of the large ascending triangle target from the two week May consolidation. If we consider that the large ascending triangle may have, in fact, been a pennant (which is where I'm leaning at this time and I outlined it in red for you), then the height of the flagpole leads to a target of $11,450 which is also just above the R4 pivot at $11,400. However, I am not ruling out a possible push higher either before a correction of this first wave set.
If you've been following me, then you know that our inability to draw a parallel line from wave 2 to what I have been considering as a possibility of being wave 4, without cutting out various candles, is troubling me. More importantly, so is the fact that wave 2 was 1.5 months long while wave 4 was only a couple of days. This continues to have me considering the idea that we are only completing wave 3 at this time. So the targets discussed above would result in a wave 4 retracement of about a month, before completing wave 5.
In terms of the 2018 accumulation TR, the higher target of this wave 3 would have price targeting anywhere from just under the top of the TR ($11,780 on Bitstamp) to the 2018 large descending wedge target ($14,000-$14,500) which is what we should normally expect for the JAC (Jump Across the Creek) as price prints an SOS (Show of Strength). The monthly R1 pivot is around $12,900 as well. The retracement for wave 4 would then print the BUEC/LPS (Back-Up to the Edge of the Creek/Last Point of Support) and wave 5 would print another SOS. Wave 5 could then target the monthly R2 pivot around $22,000, or even a bit higher. This would allow the larger correction afterward to remain above the $10,000 level while still retreating 50%-61.8% as we would normally expect.
In all, this would give us a wave 4 correction from June-August with wave 5 possibly topping out at the end of the year, thereby fitting into our normally-expected cycle. But, remember, this is all highly speculative and is just meant to make you think beyond simple kneejerk emotional reactions. It combines Elliott Wave with Wyckoff and market cycles. But until it begins playing out, traders should remain cautious. I often hear arguments that cryptotwitter is too bullish so we have to correct. While derived from truisms, the fact is that most of cryptotwitter doesn't truly understand how to apply herd mentality to market action. So what they believe to be as "everyone is too bullish" doesn't translate into their expected movement (below $5000). Again, the bullishness can be corrected by a wave 4 retracement toward $8000 after a touch of $14,000 as well.
Every day, we have a choice to act positively or negatively, so if you get a chance, do something decent for someone today which could be as simple as sharing a nice word with them. You just might change their day, or even their life.
You can always click on the "share" button in the lower right hand of the screen, under the chart, and then click on "Make it mine" from the popup menu in order to get a live version of the chart that you can explore on your own.
Related publications
Disclaimer
The information and publications are not meant to be, and do not constitute, financial, investment, trading, or other types of advice or recommendations supplied or endorsed by TradingView. Read more in the Terms of Use.
Related publications
Disclaimer
The information and publications are not meant to be, and do not constitute, financial, investment, trading, or other types of advice or recommendations supplied or endorsed by TradingView. Read more in the Terms of Use.