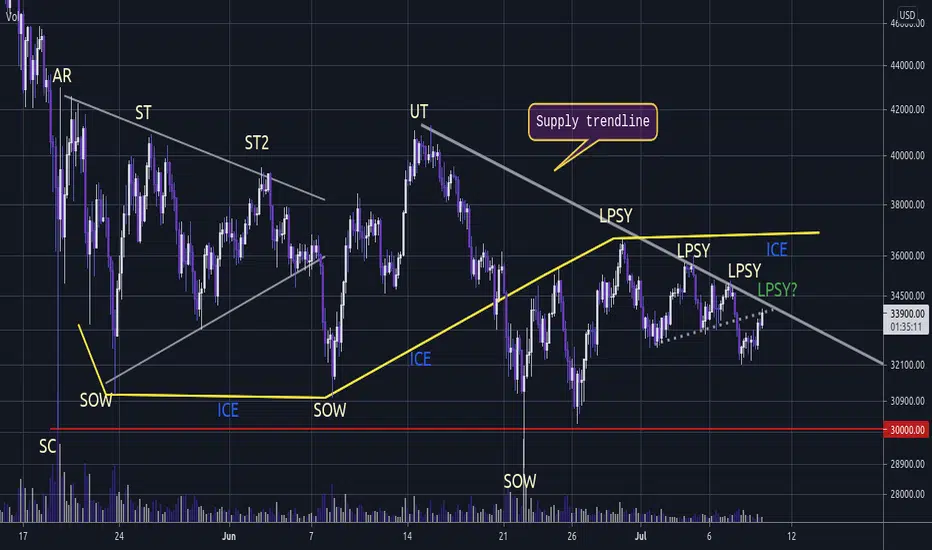
Ok so this may be the umpteenth re-distribution / accumulation you've seen by now and perhaps gritting your teeth at the sight of another, but having compared BTC with some re-distribution charts, it seems to fit best and perhaps more useful then EW counts - we'll see.
Essentially the formation seems to have 2 distinct areas with "ICE" the separation, where in this instance SOW pierces down from UT to form a lower low. The interesting part is that from herein the "supply trendline" should hold for a time as the downtrend resumes. Here this could be into a next capitulation.
d.stockcharts.com/img/articles/2015/11/1446837631954895112336.png
Not advice.
Note
Price is drifting but as I said in the EW thread, the pertinent factors are lower highs lower lows and a tightening price band.Anyhow price looking like it will drift then roll off the table à la BTC 2018 6K.
Note
Back under the supply trendline. This seems to be a common theme to learn with crypto. Price really drifts then returns to form. Lets see if the trendline holds this time.Your FA guru can't read a chart💭
I run a technical group with lots of content every day + regular videos, 1:1, chatroom 🚀.
Better than all the rest? My record speaks for itself 💡.
Telegram Group: $50 per month✨.
Contact: t.me/dRends35
I run a technical group with lots of content every day + regular videos, 1:1, chatroom 🚀.
Better than all the rest? My record speaks for itself 💡.
Telegram Group: $50 per month✨.
Contact: t.me/dRends35
Disclaimer
The information and publications are not meant to be, and do not constitute, financial, investment, trading, or other types of advice or recommendations supplied or endorsed by TradingView. Read more in the Terms of Use.
Your FA guru can't read a chart💭
I run a technical group with lots of content every day + regular videos, 1:1, chatroom 🚀.
Better than all the rest? My record speaks for itself 💡.
Telegram Group: $50 per month✨.
Contact: t.me/dRends35
I run a technical group with lots of content every day + regular videos, 1:1, chatroom 🚀.
Better than all the rest? My record speaks for itself 💡.
Telegram Group: $50 per month✨.
Contact: t.me/dRends35
Disclaimer
The information and publications are not meant to be, and do not constitute, financial, investment, trading, or other types of advice or recommendations supplied or endorsed by TradingView. Read more in the Terms of Use.