🔍 Overview
Bitcoin has executed a strong bullish recovery over the past few sessions, breaking out of a well-structured bullish channel and testing a significant resistance zone. The move exhibits traits often identified in MMC strategies, including liquidity grabs, engineered price action, and trap-based breakouts.
This chart analysis combines curve support structures, channel dynamics, and resistance reactions—all crucial components of technical strategy layered with smart money behavioral cues from MMC.
🔹 Price Action Breakdown
📈 1. Blue Ray – Liquidity Shift Signal
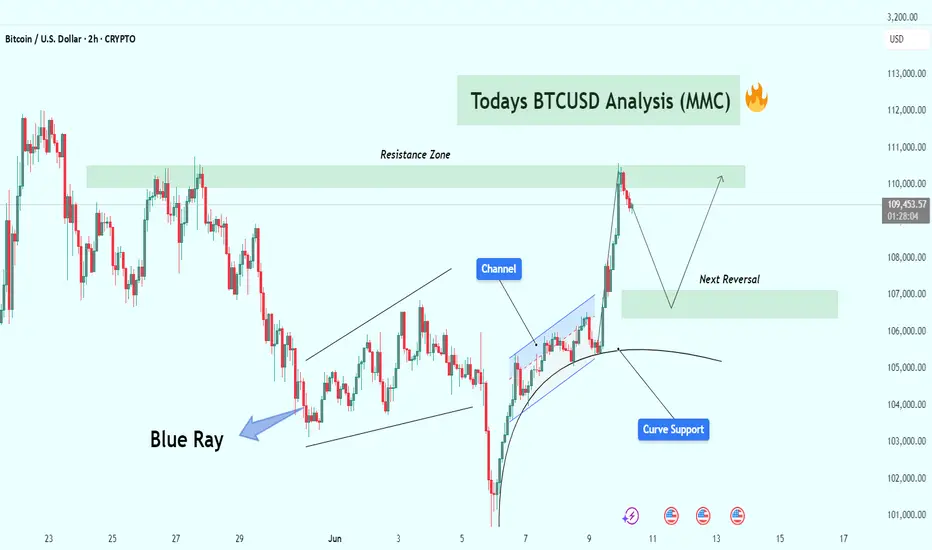
The bullish impulse was initiated from what is labeled the "Blue Ray" zone—a deep liquidity pocket often used by smart money to trap sellers.
This area marks a liquidity sweep after a steep selloff, creating the perfect environment for institutional buy orders to fill before driving price upward.
📉 2. Channel Formation & Breakout
A clean ascending bullish channel formed during the rally, showing a methodical stair-step price climb.
This consolidation phase provided multiple reentry opportunities before a sharp breakout, which signals a transition from accumulation to expansion, often seen in MMC mapping.
🧭 3. Curve Support – Parabolic Price Action
Price hugged a curve support line, often interpreted as a parabolic base.
This curve reflects increasing momentum—buyers are stepping in earlier at each dip, creating higher lows in a tightening arc.
This structure is also commonly seen in smart money accumulation zones as price is pushed upward while retail sentiment lags.
🚧 4. Resistance Zone – High Interest Reversal Region
BTCUSD is now inside a key resistance zone (~$109,800–$111,500), which has acted as both supply and previous swing highs.
MMC traders often identify these zones as trap areas, where price gets aggressively pushed up to fill institutional short orders.
This zone contains high sell-side liquidity, meaning there's a strong chance for a reversal or false breakout.
🔄 5. Projected Reversal Zone
A potential correction could bring price down to the next reversal zone (around $106,500–$107,500).
This zone is supported by:
The curve structure, which is still active.
Previous minor resistance turned support.
Institutional demand likely waiting to reload long positions.
📉 Possible Scenarios
✅ Bullish Continuation
If BTC can break and sustain above $111,500, especially with strong volume, it will likely push into new local highs.
In this case, curve support may be used for re-entry on pullbacks.
❌ Bearish Reversal Setup
A rejection from this resistance zone—especially with a long-wick candle, engulfing pattern, or divergence—could confirm a short-term top.
MMC-style reversals often occur quickly and aggressively, trapping late buyers.
⚙️ Trade Management Insights
Trade Setup Entry Area Target Stop-Loss Notes
Aggressive Short ~$110,800 ~$107,500 ~$111,800 Only on strong rejection pattern
Conservative Long ~$107,000 Retest $110,000+ Below $105,500 Only if curve support holds clean
Breakout Buy Above $111,800 Open upside Below $110,000 Wait for breakout + retest
🧠 MMC Observations
Price Engineering: The market moved through clean zones quickly—classic MMC manipulation to clear liquidity.
Trap Zones: The resistance zone may act as a bull trap where late retail buyers are absorbed.
Smart Money Flow: Institutional traders may now shift to distribution mode unless curve support holds firmly.
💬 Final Thoughts
Bitcoin is at a key decision point. Traders should remain flexible but vigilant. The presence of curve support combined with aggressive upward momentum suggests bullish strength, but the resistance zone and prior liquidity behavior warn of potential trap activity.
Monitor the reaction closely in the next 1–2 candles. A failed breakout could trigger a swift 2–3K retracement.
📌 Tip: Combine this analysis with on-chain volume or open interest data for better conviction.
Bitcoin has executed a strong bullish recovery over the past few sessions, breaking out of a well-structured bullish channel and testing a significant resistance zone. The move exhibits traits often identified in MMC strategies, including liquidity grabs, engineered price action, and trap-based breakouts.
This chart analysis combines curve support structures, channel dynamics, and resistance reactions—all crucial components of technical strategy layered with smart money behavioral cues from MMC.
🔹 Price Action Breakdown
📈 1. Blue Ray – Liquidity Shift Signal
The bullish impulse was initiated from what is labeled the "Blue Ray" zone—a deep liquidity pocket often used by smart money to trap sellers.
This area marks a liquidity sweep after a steep selloff, creating the perfect environment for institutional buy orders to fill before driving price upward.
📉 2. Channel Formation & Breakout
A clean ascending bullish channel formed during the rally, showing a methodical stair-step price climb.
This consolidation phase provided multiple reentry opportunities before a sharp breakout, which signals a transition from accumulation to expansion, often seen in MMC mapping.
🧭 3. Curve Support – Parabolic Price Action
Price hugged a curve support line, often interpreted as a parabolic base.
This curve reflects increasing momentum—buyers are stepping in earlier at each dip, creating higher lows in a tightening arc.
This structure is also commonly seen in smart money accumulation zones as price is pushed upward while retail sentiment lags.
🚧 4. Resistance Zone – High Interest Reversal Region
BTCUSD is now inside a key resistance zone (~$109,800–$111,500), which has acted as both supply and previous swing highs.
MMC traders often identify these zones as trap areas, where price gets aggressively pushed up to fill institutional short orders.
This zone contains high sell-side liquidity, meaning there's a strong chance for a reversal or false breakout.
🔄 5. Projected Reversal Zone
A potential correction could bring price down to the next reversal zone (around $106,500–$107,500).
This zone is supported by:
The curve structure, which is still active.
Previous minor resistance turned support.
Institutional demand likely waiting to reload long positions.
📉 Possible Scenarios
✅ Bullish Continuation
If BTC can break and sustain above $111,500, especially with strong volume, it will likely push into new local highs.
In this case, curve support may be used for re-entry on pullbacks.
❌ Bearish Reversal Setup
A rejection from this resistance zone—especially with a long-wick candle, engulfing pattern, or divergence—could confirm a short-term top.
MMC-style reversals often occur quickly and aggressively, trapping late buyers.
⚙️ Trade Management Insights
Trade Setup Entry Area Target Stop-Loss Notes
Aggressive Short ~$110,800 ~$107,500 ~$111,800 Only on strong rejection pattern
Conservative Long ~$107,000 Retest $110,000+ Below $105,500 Only if curve support holds clean
Breakout Buy Above $111,800 Open upside Below $110,000 Wait for breakout + retest
🧠 MMC Observations
Price Engineering: The market moved through clean zones quickly—classic MMC manipulation to clear liquidity.
Trap Zones: The resistance zone may act as a bull trap where late retail buyers are absorbed.
Smart Money Flow: Institutional traders may now shift to distribution mode unless curve support holds firmly.
💬 Final Thoughts
Bitcoin is at a key decision point. Traders should remain flexible but vigilant. The presence of curve support combined with aggressive upward momentum suggests bullish strength, but the resistance zone and prior liquidity behavior warn of potential trap activity.
Monitor the reaction closely in the next 1–2 candles. A failed breakout could trigger a swift 2–3K retracement.
📌 Tip: Combine this analysis with on-chain volume or open interest data for better conviction.
Related publications
Disclaimer
The information and publications are not meant to be, and do not constitute, financial, investment, trading, or other types of advice or recommendations supplied or endorsed by TradingView. Read more in the Terms of Use.
Related publications
Disclaimer
The information and publications are not meant to be, and do not constitute, financial, investment, trading, or other types of advice or recommendations supplied or endorsed by TradingView. Read more in the Terms of Use.