BITCOIN SHOWS SIGNS OF BEARISH REVERSAL – KEY LEVELS TO WATCH
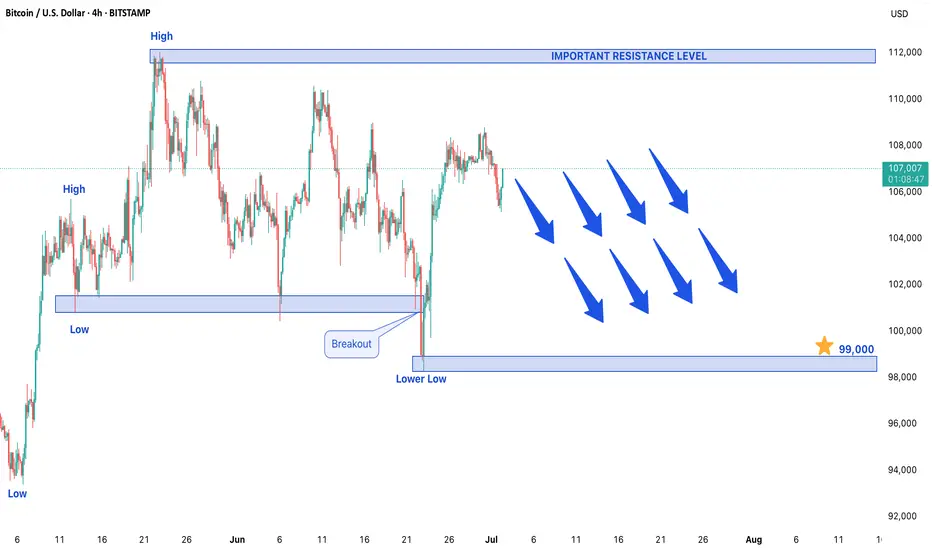
After an extended bullish run, Bitcoin is now showing early signs of a potential trend reversal as the market begins forming a bearish structure. The formation of a lower low on the price chart indicates weakening bullish momentum and suggests that sellers may be gaining control. This development comes after a sustained upward trend, signaling that a corrective phase could be underway in the cryptocurrency market.
Bearish Confirmation: Lower Low Formation
The appearance of a lower low is one of the most reliable technical indicators of a trend reversal. This pattern demonstrates that bears are successfully pushing prices below previous support levels, establishing a new downward trajectory. While this doesn't necessarily confirm a long-term bear market, it does suggest that Bitcoin could face further downside pressure in the near term. Traders should watch for confirmation through follow-through selling or additional bearish candlestick patterns.
Downside Target: $99,000 in Focus
If the bearish momentum continues, Bitcoin could test the $99,000 support level in upcoming trading sessions. This level represents a psychologically important zone where buyers may attempt to step in. However, a decisive break below this support could accelerate declines, potentially leading to deeper corrections. Traders should monitor volume and price action around this level for signs of either consolidation or continuation of the downtrend.
Resistance Level: $12,000 as Key Barrier
On the upside, $12,000 now acts as a critical resistance level. Any short-term rallies toward this zone could attract renewed selling pressure, reinforcing the bearish outlook. For the current downtrend to be invalidated, Bitcoin would need to reclaim and sustain above this resistance with strong buying volume. Until then, traders may consider selling into strength near this level while maintaining tight risk management.
Market Outlook: Correction Expected After Prolonged Rally
Given Bitcoin's history of volatile price swings, this potential reversal should not come as a complete surprise after its extended bullish run. Market participants should watch for:
- Increasing trading volume on downward moves (confirming bearish conviction)
- Potential bearish continuation patterns (like descending triangles or flag formations)
- Macro factors that could influence crypto markets (regulatory news, ETF flows, or macroeconomic shifts)
Conclusion
Bitcoin appears to be entering a corrective phase, with $99,000 as the next key downside target and $12,000 serving as major resistance. While the broader uptrend may still be intact long-term, short-term traders should prepare for potential bearish continuation. As always, proper position sizing and stop-loss strategies remain crucial in navigating Bitcoin's inherent volatility. A break above $12,000 would require reassessment of the bearish outlook.
Disclaimer
The information and publications are not meant to be, and do not constitute, financial, investment, trading, or other types of advice or recommendations supplied or endorsed by TradingView. Read more in the Terms of Use.
Disclaimer
The information and publications are not meant to be, and do not constitute, financial, investment, trading, or other types of advice or recommendations supplied or endorsed by TradingView. Read more in the Terms of Use.