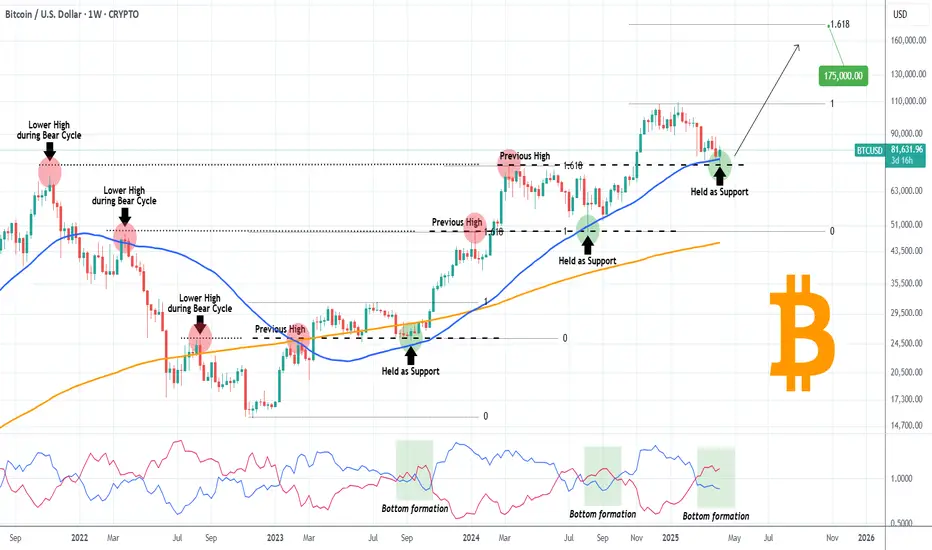
Bitcoin (BTCUSD) made a miraculous comeback yesterday as it rebounded with force almost +12% from its session Low, following the 90-day tariff pause news. This rebounded has been performed on both the 1W MA50 (blue trend-line), which has been the key long-term Support of this Bull Cycle, but also on the previous High line, which is the trend-line coming from the previous Higher High of the Bull Cycle that has now turned Support.
As you see, during every Bull Cycle correction, this previous High line held both times before and it is doing so this time also. This justifies the incredible symmetry of this Bull Cycle but it doesn't only stop on the uptrend structure but goes back to the downtrend structure of the Bear Cycle. As you see, the extension of those previous High lines intersect the Lower Highs of the Bear Cycle. Symmetry at its very best.
At the same time, back to the current Bull Cycle, we see that the Vortex Indicator (VI) has already diverged, which has been consistent to both previous bottoms.
As far as what the target of this potential rebound/ rally can be, both previous main rallies hit at least the 1.618 Fibonacci extension. That sits now at $175000.
So do you think this Double Support rebound combo is putting BTC back in Bull Cycle business for a rally to $175k? Feel free to let us know in the comments section below!
-------------------------------------------------------------------------------
** Please LIKE 👍, FOLLOW ✅, SHARE 🙌 and COMMENT ✍ if you enjoy this idea! Also share your ideas and charts in the comments section below! This is best way to keep it relevant, support us, keep the content here free and allow the idea to reach as many people as possible. **
-------------------------------------------------------------------------------
💸💸💸💸💸💸
👇 👇 👇 👇 👇 👇
👑Best Signals (Forex/Crypto+70% accuracy) & Account Management (+20% profit/month on 10k accounts)
💰Free Channel t.me/tradingshotglobal
🤵Contact info@tradingshot.com t.me/tradingshot
🔥New service: next X100 crypto GEMS!
💰Free Channel t.me/tradingshotglobal
🤵Contact info@tradingshot.com t.me/tradingshot
🔥New service: next X100 crypto GEMS!
Disclaimer
The information and publications are not meant to be, and do not constitute, financial, investment, trading, or other types of advice or recommendations supplied or endorsed by TradingView. Read more in the Terms of Use.