BTCUSDT has established a triangle pattern on the daily chart, which typically suggests trend continuation. This formation is taking shape just below the key psychological level at 70,000, hinting that the market might be gearing up for a breakout. The last weekly candle—a long-tailed bar—signals potential buying interest, reinforcing a possible upside. As we approach the monthly candle close, a close above September’s high could provide further confirmation of upward momentum.
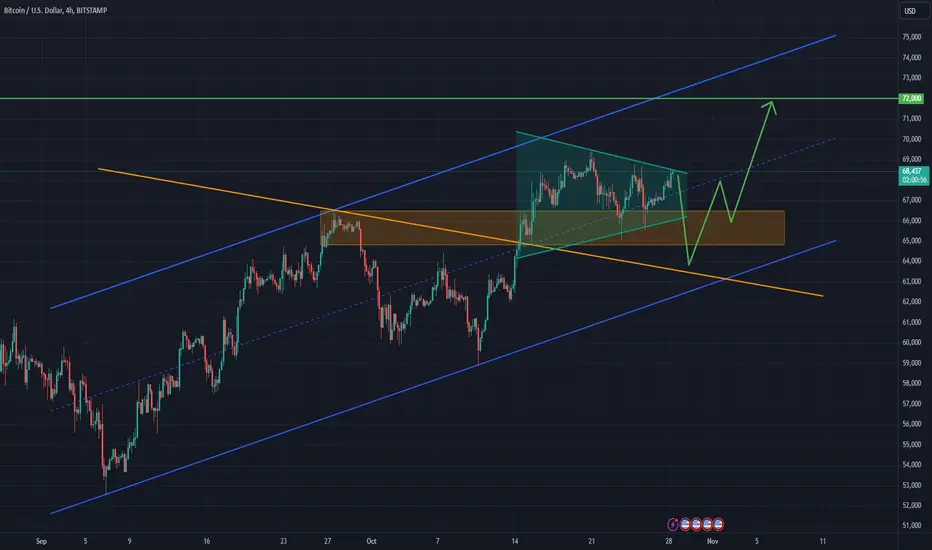
In the short term, a pullback or a fake breakout of the triangle pattern may occur, potentially leading to a retest of the all-time high. The target is the resistance zone around 72,000
In the short term, a pullback or a fake breakout of the triangle pattern may occur, potentially leading to a retest of the all-time high. The target is the resistance zone around 72,000
Trade closed: target reached
BTCUSD from the 21st of October Target reached!Price increased around 8% since the analysis was published!
Note
Correction**BTCUSD from the 28th of October Target Reached!
Price increased over 7.5% since the analysis was published!
Website - rtedinvesting.com/
Free Telegram Channel - t.me/rtedinvestingofficialfreechannel
Free Telegram Channel - t.me/rtedinvestingofficialfreechannel
Disclaimer
The information and publications are not meant to be, and do not constitute, financial, investment, trading, or other types of advice or recommendations supplied or endorsed by TradingView. Read more in the Terms of Use.