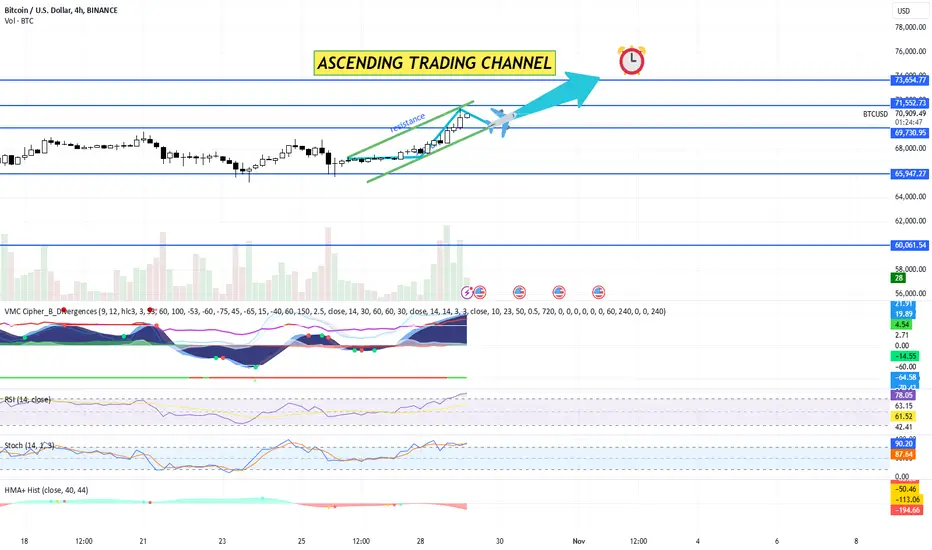
Price Levels and Resistance Zones:
The chart shows several key resistance and support levels marked by blue horizontal lines.
Major Resistance Levels:
$73,654.77
$71,552.73
$69,730.95
Support Levels:
$65,947.27
$60,061.54
$52,774.45
Bitcoin is currently trending upward, with price action near $70,734.95, approaching the resistance zone at $71,552.73.
VMC Cipher B Divergences:
The VMC Cipher B indicator shows bullish momentum with green dots, signaling possible upward continuation.
The RSI and Stochastic lines are also above mid-levels, suggesting continued bullish momentum.
RSI (Relative Strength Index):
RSI (14, close) is at 77.25, indicating overbought conditions. This could mean a possible retracement or consolidation in the short term. However, a strong uptrend may continue if Bitcoin maintains support levels above 70.
Stochastic Oscillator:
Stochastic (14, 1, 3) is also at a high level, around 86.19, indicating overbought conditions. This aligns with the RSI and could signal a need for caution on long positions until the oscillator moves back to a neutral or oversold region.
HMA+ Histogram:
The histogram indicates some bullish divergence, but recent bars are turning red, signaling a potential pullback or pause in momentum. Monitoring this for further bearish signs is essential, especially if it crosses below zero.
Trading Plan
Short-Term Strategy:
Entry: Consider entering a long position on a pullback to support around $69,730.95 if bullish signals persist.
Stop-Loss: Place a stop-loss below the $65,947.27 support level to limit potential downside risk.
Take-Profit: Target $71,552.73 as the primary take-profit level. If momentum remains strong and BTC breaks above $71,552.73, consider holding for $73,654.77.
Medium-Term Strategy:
Entry: Buy on confirmation of a breakout above $71,552.73 with strong volume.
Stop-Loss: A stop-loss slightly below the breakout level at $69,730.95.
Take-Profit: Set a take-profit target around $73,654.77. If Bitcoin breaches this, reassess the position for potential gains towards higher levels.
Risk Management:
Position Sizing: Risk no more than 1-2% of the trading account on each trade.
Trailing Stop: Implement a trailing stop if Bitcoin strongly surpasses $71,552.73, to lock in gains while allowing for additional upside.
Monitoring Indicators:
Keep an eye on RSI and Stochastic Oscillator for any signs of bearish divergence or weakening momentum.
Monitor VMC Cipher B for any shift in green dots to red, which could indicate potential retracement.
Overall Market Sentiment:
Given the current uptrend and approach to resistance, Bitcoin shows bullish sentiment. However, indicators suggest overbought conditions, so caution is advised.
Disclaimer
The information and publications are not meant to be, and do not constitute, financial, investment, trading, or other types of advice or recommendations supplied or endorsed by TradingView. Read more in the Terms of Use.
Disclaimer
The information and publications are not meant to be, and do not constitute, financial, investment, trading, or other types of advice or recommendations supplied or endorsed by TradingView. Read more in the Terms of Use.