Technical Analysis and Outlook:
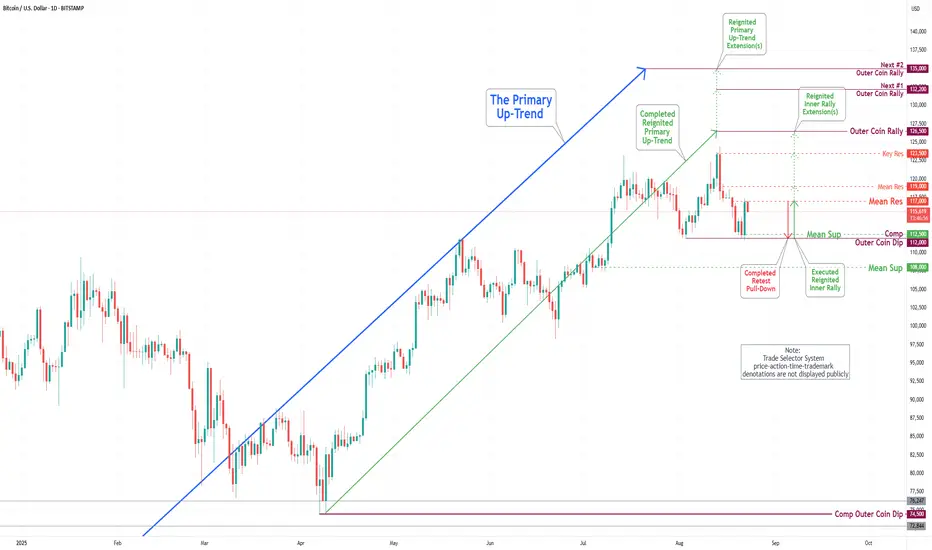
During the current trading session, the Bitcoin market has experienced a noteworthy pullback to the completed Outer Coin Dip at 112000, and as a result, has demonstrated considerable resilience, reaching the Mean Resistance (the inverse of Mean Support) at 116600 as detailed in the Daily Chart Analysis for the week of August 15. The prevailing analysis suggests that the cryptocurrency may revisit the Mean Support at 116500, as well as the completed Outer Coin Dip at 112000, before resuming its bullish trend.
During the current trading session, the Bitcoin market has experienced a noteworthy pullback to the completed Outer Coin Dip at 112000, and as a result, has demonstrated considerable resilience, reaching the Mean Resistance (the inverse of Mean Support) at 116600 as detailed in the Daily Chart Analysis for the week of August 15. The prevailing analysis suggests that the cryptocurrency may revisit the Mean Support at 116500, as well as the completed Outer Coin Dip at 112000, before resuming its bullish trend.
Related publications
Disclaimer
The information and publications are not meant to be, and do not constitute, financial, investment, trading, or other types of advice or recommendations supplied or endorsed by TradingView. Read more in the Terms of Use.
Related publications
Disclaimer
The information and publications are not meant to be, and do not constitute, financial, investment, trading, or other types of advice or recommendations supplied or endorsed by TradingView. Read more in the Terms of Use.