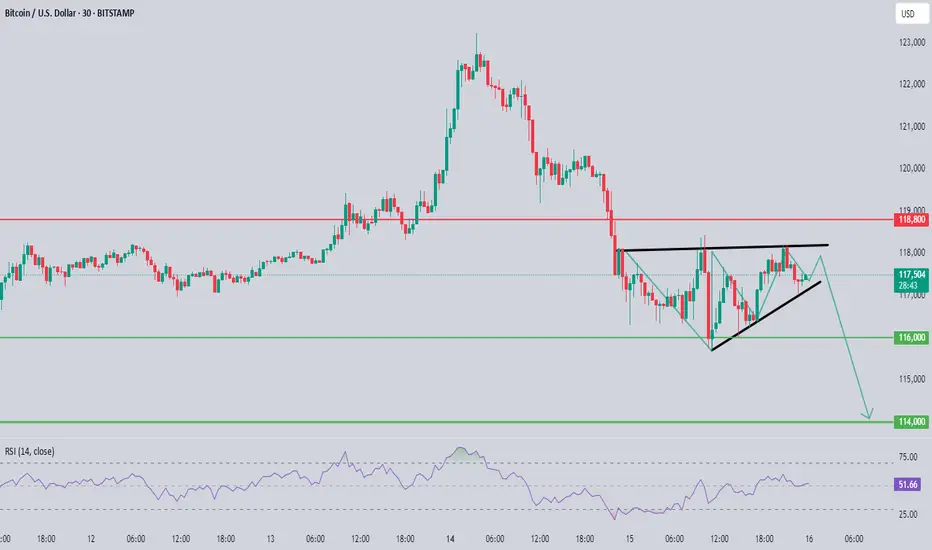
Based on the image you've shared, this is a technical analysis chart for gold (XAU/USD), with a visible bearish setup in play. Here’s a detailed sell-side analysis:
Chart Pattern Observed
Bearish Pennant/Wedge Breakout:
The price appears to be breaking out downward from a rising wedge or bearish pennant pattern.
These patterns typically indicate a continuation to the downside after a short consolidation or pullback.
Key Levels Identified
Resistance Zone:
118.800 (Strong resistance level marked in red)
Price failed to break above this and reversed, confirming it as a solid supply zone.
Current Price: Around 117.500
Support Levels (Take Profit Targets):
116.000 – Minor support/first TP level
114.000 – Major support/final TP level (likely the full target of the move)
RSI Indicator
RSI at 50.71 – neutral but pointing slightly downward.
This gives room for further bearish momentum to unfold.
Sell Trade Setup
Entry: After confirmed break below the rising trendline (around 117.800 - 117.500)
Stop Loss: Above 118.800 (just above the resistance zone to avoid fakeouts)
Take Profits:
TP1: 116.000
TP2: 114.000
Trade Justification
Clear lower highs forming.
Rejection at strong resistance.
Breakdown of rising structure = bearish continuation.
Bearish projection arrows on chart suggest institutional outlook favors sell.
Risk Management
Use proper lot sizing based on your account balance and risk %.
Look for a retest of the trendline as a safer sell entry if missed the initial break.
We provide 3-4 signals every day, including stop loss and big tips along with scalping signal plus more pips targets
t.me/+w5M8RMp21PlkNjZk
t.me/+w5M8RMp21PlkNjZk
Disclaimer
The information and publications are not meant to be, and do not constitute, financial, investment, trading, or other types of advice or recommendations supplied or endorsed by TradingView. Read more in the Terms of Use.