I have never been a fan of logarithmic charts - especially in the short-term. I don't believe they give an accurate picture of the state of the market now.
If being used for longer term analysis, sure. But then again, I have never been one for using patterns from a long time ago with crypto.
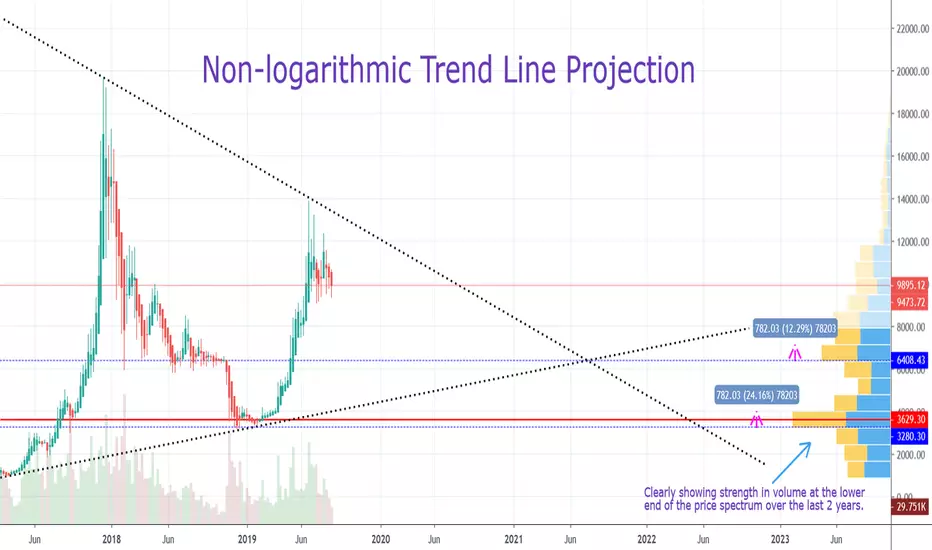
Here we have a trendline projection on a non-logarithmic chart of BTCUSD from 2017's rise to today. This isn't a prediction but a likely scenario of where BTC could be headed =if on a continued downtrend.
Projecting forwards and using the volume profile where most activity has occurred, it does look like BTC favours a lower price point (or 'fair value'). At the lower end of the spectrum, we have values ranging from 3300-4000. At the higher end of the spectrum, prices range from 6400-7000 approximately. The trend line projection is bang on the 6400 mark. It is uncanny that this is also the exact line that provided support last year...or maybe it isn't so uncanny.
(Point to keep in mind is that this is only a projection from the last year or so.)
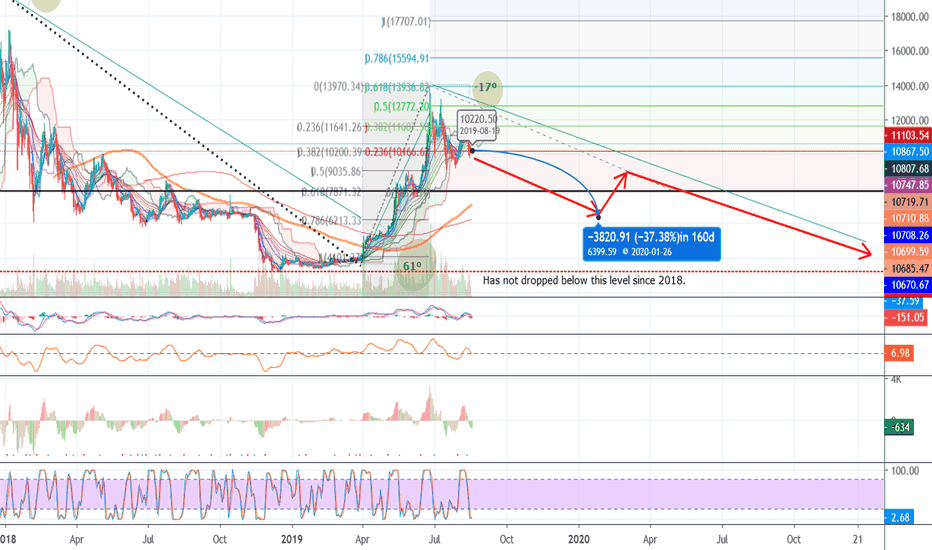
Based on my previous analysis of BTC hitting the 7800 mark (see image below), this trend line projection would only be achieved if it breaks down from the bottom of this analysis with a view of it hitting this target around July 2021.

This analysis is meant to be used in cojunction with my long-term projection analysis here:
As always, I will continue to monitor the market and trend, and provide on-point trade signals for long stops should it continue to head down.
-------------------
Premium private trend analysis charts and on-point trade signals on Purple Crypto Premium.
Contact me for details.
t.me/purplecrypto
If being used for longer term analysis, sure. But then again, I have never been one for using patterns from a long time ago with crypto.
Here we have a trendline projection on a non-logarithmic chart of BTCUSD from 2017's rise to today. This isn't a prediction but a likely scenario of where BTC could be headed =if on a continued downtrend.
Projecting forwards and using the volume profile where most activity has occurred, it does look like BTC favours a lower price point (or 'fair value'). At the lower end of the spectrum, we have values ranging from 3300-4000. At the higher end of the spectrum, prices range from 6400-7000 approximately. The trend line projection is bang on the 6400 mark. It is uncanny that this is also the exact line that provided support last year...or maybe it isn't so uncanny.
(Point to keep in mind is that this is only a projection from the last year or so.)
Based on my previous analysis of BTC hitting the 7800 mark (see image below), this trend line projection would only be achieved if it breaks down from the bottom of this analysis with a view of it hitting this target around July 2021.
This analysis is meant to be used in cojunction with my long-term projection analysis here:
As always, I will continue to monitor the market and trend, and provide on-point trade signals for long stops should it continue to head down.
-------------------
Premium private trend analysis charts and on-point trade signals on Purple Crypto Premium.
Contact me for details.
t.me/purplecrypto
📈 Exclusive private charts on Telegram: t.me/purple_crypto
▶ Bitchute: bitchute.com/channel/9HWKbDRnLQRD
🌀 Join
▶ Bitchute: bitchute.com/channel/9HWKbDRnLQRD
🌀 Join
Related publications
Disclaimer
The information and publications are not meant to be, and do not constitute, financial, investment, trading, or other types of advice or recommendations supplied or endorsed by TradingView. Read more in the Terms of Use.