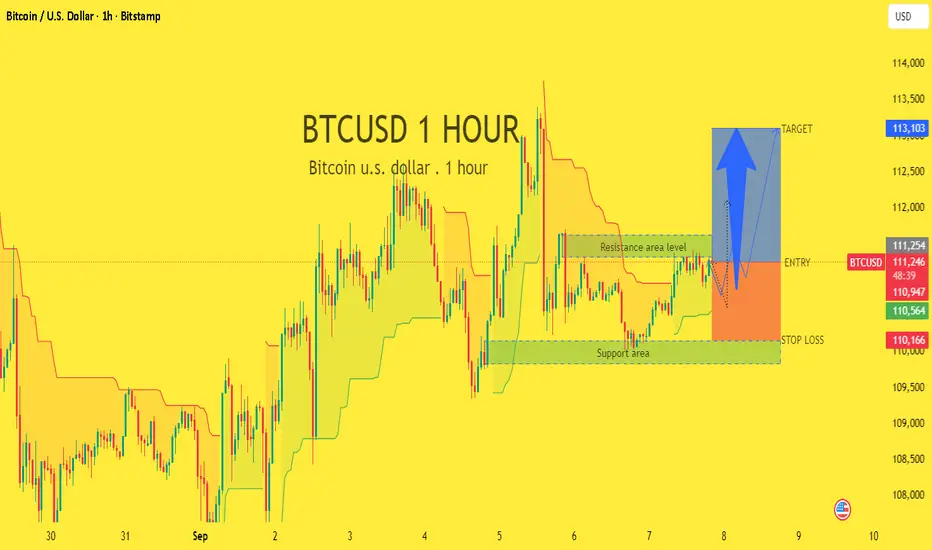
BTCUSD 1-Hour chart you shared 👇
1. Price Level
Current BTC price: $111,284
2. Support & Resistance
Support area: Around $110,000 – $110,550
Resistance area level: Around $111,500
Target zone: Around $113,000 – $113,200
3. Supertrend (indicator)
The green/red cloud suggests BTC is hovering near a potential bullish breakout zone
4. Trade Setup (highlighted on chart)
Entry: Around $111,500 breakout
Stop Loss: Around $110,000 – $110,200
Target: Around $113,000
Bullish Case
If BTC breaks and holds above $111,500 resistance, momentum could push it toward the $113,000 target zone.
Risk-to-reward (R:R) seems favorable if entry is near resistance breakout.
If BTC fails to break $111,500 and rejects strongly:
It could revisit the support zone ($110,000–$110,500).
A break below $110,000 would invalidate the bullish setup and may open downside toward $109,000.
Bullish Trade Plan:
Entry: Above $111,500 (confirmed breakout candle close).
Stop Loss: $110,000–$110,200.
Target: $113,000 (potential R:R ≈ 1:2).
Bearish Scenario:
Watch for rejection at $111,500.
If price closes below $110,000, downside continuation likel
Trade closed: target reached
Congratulations guys our buy side chart analysis has been hit with along 180 pips moves in buy positionBest Analysis xauusd single
t.me/+uAIef7IqwSs4M2Q0
VIP PREMIMUM ANALYSIS ROOM SIGNALS
t.me/+uAIef7IqwSs4M2Q0
t.me/+uAIef7IqwSs4M2Q0
VIP PREMIMUM ANALYSIS ROOM SIGNALS
t.me/+uAIef7IqwSs4M2Q0
Disclaimer
The information and publications are not meant to be, and do not constitute, financial, investment, trading, or other types of advice or recommendations supplied or endorsed by TradingView. Read more in the Terms of Use.
Best Analysis xauusd single
t.me/+uAIef7IqwSs4M2Q0
VIP PREMIMUM ANALYSIS ROOM SIGNALS
t.me/+uAIef7IqwSs4M2Q0
t.me/+uAIef7IqwSs4M2Q0
VIP PREMIMUM ANALYSIS ROOM SIGNALS
t.me/+uAIef7IqwSs4M2Q0
Disclaimer
The information and publications are not meant to be, and do not constitute, financial, investment, trading, or other types of advice or recommendations supplied or endorsed by TradingView. Read more in the Terms of Use.